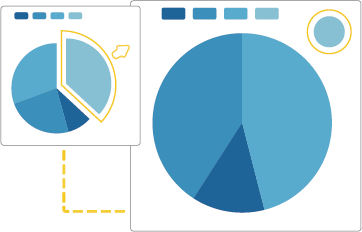
Our "Drag-Recalculate" feature (patented) brings you the best user experience ever: by allowing you to effectively extract, integrate, or even exchange data among multiple charts, ECharts opens you up every opportunity for data mining and integration.
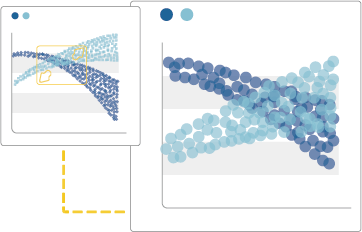
Got tens of millions of data to present? And once again professional statistical tools (e.g. MATLAB) seem like the only option left? Nope, not anymore! Despite rich interactivity, ECharts can still plot up to 200,000 data points on a Cartesian chart (line, column, scatter, candlestick) in the blink of an eye.
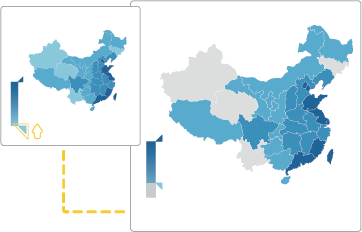
The colors in the Cartesian chart (like map or scatter) will help you to classify data at first glance. But how to focus on data that matters after the initial analysis? With our "Scale Roaming" feature, you can turn off other scales and focus on the scale you are interested in with just a click.
"ECharts is a treasure, not just for China, but also for the world."
Chen Wei, Professor at Zhejiang University
"ECharts, the beauty of data visualization!"
Shen Hao, Professor at Communication University of China
"ECharts is not only the best, but also the most improved visualization tool I know. Hopes are high that it will become a world-class open source project before long."
Huang Zhimin, CTO of Caixin Media
"ECharts is a most impressive tool for data visualization: it's fully open-source, it's sophisticated-yet-flexible, and it keeps abreast of the era of 'big data'! I hope that ECharts will stick to the open source approach and bring into full play the power of community, so as to better serve users at home and abroad and create greater value in business and society."
Xing Bao, Founder of DataUnion
"It is my fervent hope that ECharts 2.0 can make their visualization more vivid, charts more shining, interaction more agreeable and leave their users nothing to worry about."
Hong Bei, CTO of AdMaster
"We have tried all kinds of charting tools - foreign and domestic, free and paid - for many years, and we say that ECharts absolutely stands out in the free ones, and is even comparable to the best of the paid ones."
Yu Jie, GM of ResearchInChina
"ECharts is open, simple and elegant. 1.0 was great, and 2.0 was leapfrogged in just a year with something even more amazing. Anecdotally, some of my American friends are learning ECharts with online translators!"
Xie Yihui, Founder of Capital of Statistics
"ECharts represents a new generation of visualization tools for big data. I really hope that it will soon support mobile platforms, so that we can have the freedom to explore big data at our fingertips - both literally and figuratively."
Hu Song, CTO of haizhi


We are just doing our best to present your data in its own true aspect, and provide you with intuitive, interactive ways for data mining, extraction, correction or integration, so that you can focus on what you are interested in. Legend Switch, Area Zoom, and Value Filter let you analyze your data in ways you didn't think possible.
Look at the charts created using ECharts, you are no longer just a "reader"; you can also be a "creator". This is ECharts, a GUI-based data visualization tool that we are working on.
ECharts is an open source from the data visualization team of Baidu EFE. In EFE, we also have: