# 表格结构和内容预测
## pipeline
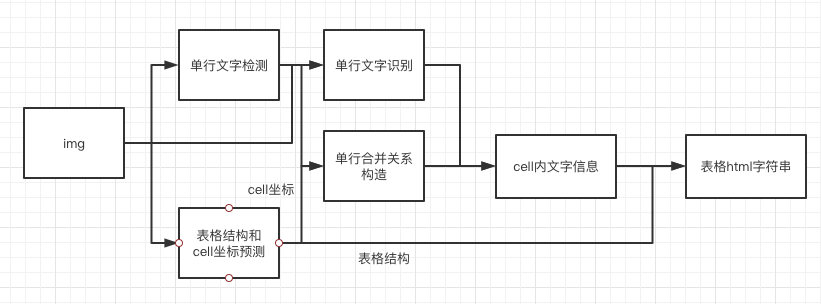
表格的ocr主要包含三个模型
1. 单行文本检测-DB
2. 单行文本识别-CRNN
3. 表格结构和cell坐标预测-RARE
具体流程图如下

1. 图片由单行文字检测检测到单行文字的坐标,然后送入识别模型拿到识别结果。
2. 图片由表格结构和cell坐标预测拿到表格的结构信息和单元格的坐标信息。
3. 由单行文字的坐标、识别结果和单元格的坐标一起组合出单元格的识别结果。
4. 单元格的识别结果和表格结构一起构造表格的html字符串。
## 使用
### 训练
TBD
### 评估
先cd到PaddleOCR/ppstructure目录下
表格使用 TEDS(Tree-Edit-Distance-based Similarity) 作为模型的评估指标。在进行模型评估之前,需要将pipeline中的三个模型分别导出为inference模型(我们已经提供好),还需要准备评估的gt, gt示例如下:
```json
{"PMC4289340_004_00.png": [["", "", "", "", "", "| ", " | ", "", " | ", "", " | ", "
", "", "", "", "| ", " | ", "", " | ", "", " | ", "
", "", "
", "", ""], [[1, 4, 29, 13], [137, 4, 161, 13], [215, 4, 236, 13], [1, 17, 30, 27], [137, 17, 147, 27], [215, 17, 225, 27]], [["", "F", "e", "a", "t", "u", "r", "e", ""], ["", "G", "b", "3", " ", "+", ""], ["", "G", "b", "3", " ", "-", ""], ["", "P", "a", "t", "i", "e", "n", "t", "s", ""], ["6", "2"], ["4", "5"]]]}
```
示例对应的表格如下

准备完成后使用如下命令进行评估,评估完成后会输出teds指标。
```python
python3 table/eval_table.py --det_model_dir=path/to/det_model_dir --rec_model_dir=path/to/rec_model_dir --structure_model_dir=path/to/structure_model_dir --image_dir=../doc/table/1.png --rec_char_dict_path=../ppocr/utils/dict/table_dict.txt --table_char_dict_path=../ppocr/utils/dict/table_structure_dict.txt --rec_char_type=EN --det_limit_side_len=736 --det_limit_type=min --gt_path=path/to/gt.json
```
### 预测
先cd到PaddleOCR/ppstructure目录下
```python
python3 table/predict_table.py --det_model_dir=path/to/det_model_dir --rec_model_dir=path/to/rec_model_dir --structure_model_dir=path/to/structure_model_dir --image_dir=../doc/table/1.png --rec_char_dict_path=../ppocr/utils/dict/table_dict.txt --table_char_dict_path=../ppocr/utils/dict/table_structure_dict.txt --rec_char_type=EN --det_limit_side_len=736 --det_limit_type=min --output ../output/table
```
运行完成后,每张图片的excel表格会保存到table_output字段指定的目录下