[**中文**](./README.md)


## Introduction
VisualDL, a visualization analysis tool of PaddlePaddle, provides a variety of charts to show the trends of parameters, and visualizes model structures, data samples, histograms of tensors and high-dimensional data distributions. It enables users to understand the training process and the model structure more clearly and intuitively so as to optimize models efficiently.
VisualDL provides various visualization functions, including tracking metrics in real-time, visualizing the model structure, displaying the data sample, presenting the changes of distributions of tensors, projecting high-dimensional data to a lower dimensional space and more. For specific guidelines of each function, please refer to [**VisualDL User Guide**](./docs/components/UserGuide-en.md). Currently, VisualDL iterates rapidly and new functions will be continously added.
VisualDL natively supports the use of Python. Developers can retrieve plentiful visualization results by simply adding a few lines of Python code into the model before training.
## Contents
* [Key Highlights](#Key-Highlights)
* [Installation](#Installation)
* [Usage Guideline](#Usage-Guideline)
* [Function Preview](#Function-Preview)
* [Contribution](#Contribution)
* [More Details](#More-Details)
* [Technical Communication](#Technical-Communication)
## Key Highlights
### Easy to Use
The high-level design of API makes it easy to use. Only one click can initiate the visualization of model structures.
### Various Functions
The function contains the visualization of training parameters, data samples, graph structures, histograms of tensors, PR curves and high-dimensional data.
### High Compatibility
VisualDL provides the visualization of the mainstream model structures such as Paddle, ONNX, Caffe, widely supporting visual analysis for diverse users.
### Fully Support
By Integrating into PaddlePaddle and related modules, VisualDL allows developers to use different components unobstructed, and thus have the best experience in the PaddlePaddle ecosystem.
## Installation
### Install by Pip
```shell
pip install --upgrade --pre visualdl
```
### Install by Code
```
git clone https://github.com/PaddlePaddle/VisualDL.git
cd VisualDL
python setup.py bdist_wheel
pip install --upgrade dist/visualdl-*.whl
```
Please note that Python 2 is no longer maintained officially since January 1, 2020. VisualDL now only supports Python 3 in order to ensure the usability of codes.
## Usage Guideline
VisualDL stores the data, parameters and other information of the training process in a log file. Users can launch the panel to observe the visualization results.
### 1. Log
The Python SDK is provided at the back end of VisualDL, and a logger can be customized through LogWriter. The interface description is shown as follows:
```python
class LogWriter(logdir=None,
comment='',
max_queue=10,
flush_secs=120,
filename_suffix='',
write_to_disk=True,
**kwargs)
```
#### Interface Parameters
| parameters | type | meaning |
| --------------- | ------- | ------------------------------------------------------------ |
| logdir | string | The path location of log file. VisualDL will create a log file under this path to record information generated by the training process. If not specified, the path will be `runs/${CURRENT_TIME}`as default. |
| comment | string | Add a suffix to the log folder name, which is invalid if logdir is already specified. |
| max_queue | int | The maximum capacity of the data generated before recording in a log file. If the capacity is reached, the data is immediately written into the log file. |
| flush_secs | int | The maximum cache time of the data generated before recording in a log file, when this time is reached, the data is immediately written to the log file. |
| filename_suffix | string | Add a suffix to the default log file name. |
| write_to_disk | boolean | Write into disk or not. |
#### Example
Create a log file and record scalar values:
```python
from visualdl import LogWriter
# create a log file under `./log/scalar_test/train`
with LogWriter(logdir="./log/scalar_test/train") as writer:
# use `add_scalar` to record scalar values
writer.add_scalar(tag="acc", step=1, value=0.5678)
writer.add_scalar(tag="acc", step=2, value=0.6878)
writer.add_scalar(tag="acc", step=3, value=0.9878)
```
### 2. Launch Panel
In the above example, the log has recorded three sets of scalar values. Develpers can view the visualization results of the log file through launching the visualDL panel. There are two ways to launch a log file:
#### Launch by Command Line
Use the command line to launch the VisualDL panel:
```python
visualdl --logdir --host --port --cache-timeout --language --public-path --api-only
```
Parameter details:
| parameters | meaning |
| --------------- | ------------------------------------------------------------ |
| --logdir | Set one or more directories of the log. VisualDL will search the log file recursively under this path to display the all experimental results. |
| --host | Specify IP address. The default value is·`127.0.0.1`. |
| --port | Set the port. The default value is`8040`. |
| --cache-timeout | Cache time of the backend. During the cache time, the front end requests the same URL multiple times, and then the returned data is obtained from the cache. The default cache time is 20 seconds. |
| --language | The language of the VisualDL panel. Language can be specified as 'en' or 'zh', and the default is the language used by the browser. |
| --public-path | The URL path of the VisualDL panel. The default path is '/app', meaning that the access address is 'http://<host>:<port>/app'. |
| --api-only | Decide whether or not to provide only API. If this parameter is set, VisualDL will only provides API service without displaying the web page, and the API address is 'http://<host>:<port>/<public_path>/api'. Additionally, If the public_path parameter is not specified, the default address is 'http://<host>:<port>/api'. |
To visualize the log file generated in the previous step, developers can launch the panel through the command:
```
visualdl --logdir ./log
```
#### Launch in Python Script
Developers can start the VisualDL panel in Python script as follows:
```python
visualdl.server.app.run(logdir,
host="127.0.0.1",
port=8080,
cache_timeout=20,
language=None,
public_path=None,
api_only=False,
open_browser=False)
```
Please note: since all parameters are indefinite except `logdir`, developers should specify parameter names when using them.
The interface parameters are as follows:
| parameters | type | meaning |
| ------------- | -------------------------------------------------- | ------------------------------------------------------------ |
| logdir | string or list[string_1, string_2, ... , string_n] | Set one or more directories of the log. VisualDL will search the log file recursively under this path to display the all experimental results. |
| host | string | Specify IP address. The default value is·`127.0.0.1`. |
| port | int | Set the port. The default value is`8040`. |
| cache_timeout | int | Cache time of the backend. During the cache time, the front end requests the same URL multiple times, and then the returned data is obtained from the cache. The default cache time is 20 seconds. |
| language | string | The language of the VisualDL panel. Language can be specified as 'en' or 'zh', and the default is the language used by the browser. |
| public_path | string | The URL path of the VisualDL panel. The default path is '/app', meaning that the access address is 'http://<host>:<port>/app'. |
| api_only | boolean | Decide whether or not to provide only API. If this parameter is set, VisualDL will only provides API service without displaying the web page, and the API address is 'http://<host>:<port>/<public_path>/api'. Additionally, If the parameter public_path is not specified, the default address is 'http://<host>:<port>/api'. |
| open_browser | boolean | Whether or not to open the browser. If this parameter is set as True, the browser will be openned automatically and VisualDL panel will be launched at the same time. If parameter api_only is specified as True, parameter open_browser can be ignored. |
To visualize the log file generated in the previous step, developers can launch the panel through the command:
```python
from visualdl.server import app
app.run(logdir="./log")
```
After launching the panel by one of the above methods, developers can see the visualization results on the browser shown as blow:

## Function Preview
### Scalar
**Scalar** makes use of various charts to display how the parameters, such as accuracy, loss and learning rate, change during the training process. In this case, developers can observe not only the single but also the multiple groups of parameters in order to understand the training process and thus speed up the process of model tuning.
#### Dynamic Display
After the launchment of VisualDL Board, the LogReader will continuously record the data to display in the front-end. Hence, the changes of parameters can be visualized in real-time, as shown below:
#### Comparison of Multiple Experiments
Developers can compare with multiple experiments by specifying and uploading the path of each experiment at the same time so as to visualize the same parameters in the same chart.
### Image
**Image** provides real-time visualizations of the image data during the training process, allowing developers to observe the changes of images in different training stages and to deeply understand the effects of the training process.
### Graph
**Graph** enables developers to visualize model structures by only one click. Moreover, **Graph** allows Developers to explore model attributes, node information, node input and output. aiding them analyze model structure quickly and understand the direction of data flow easily.

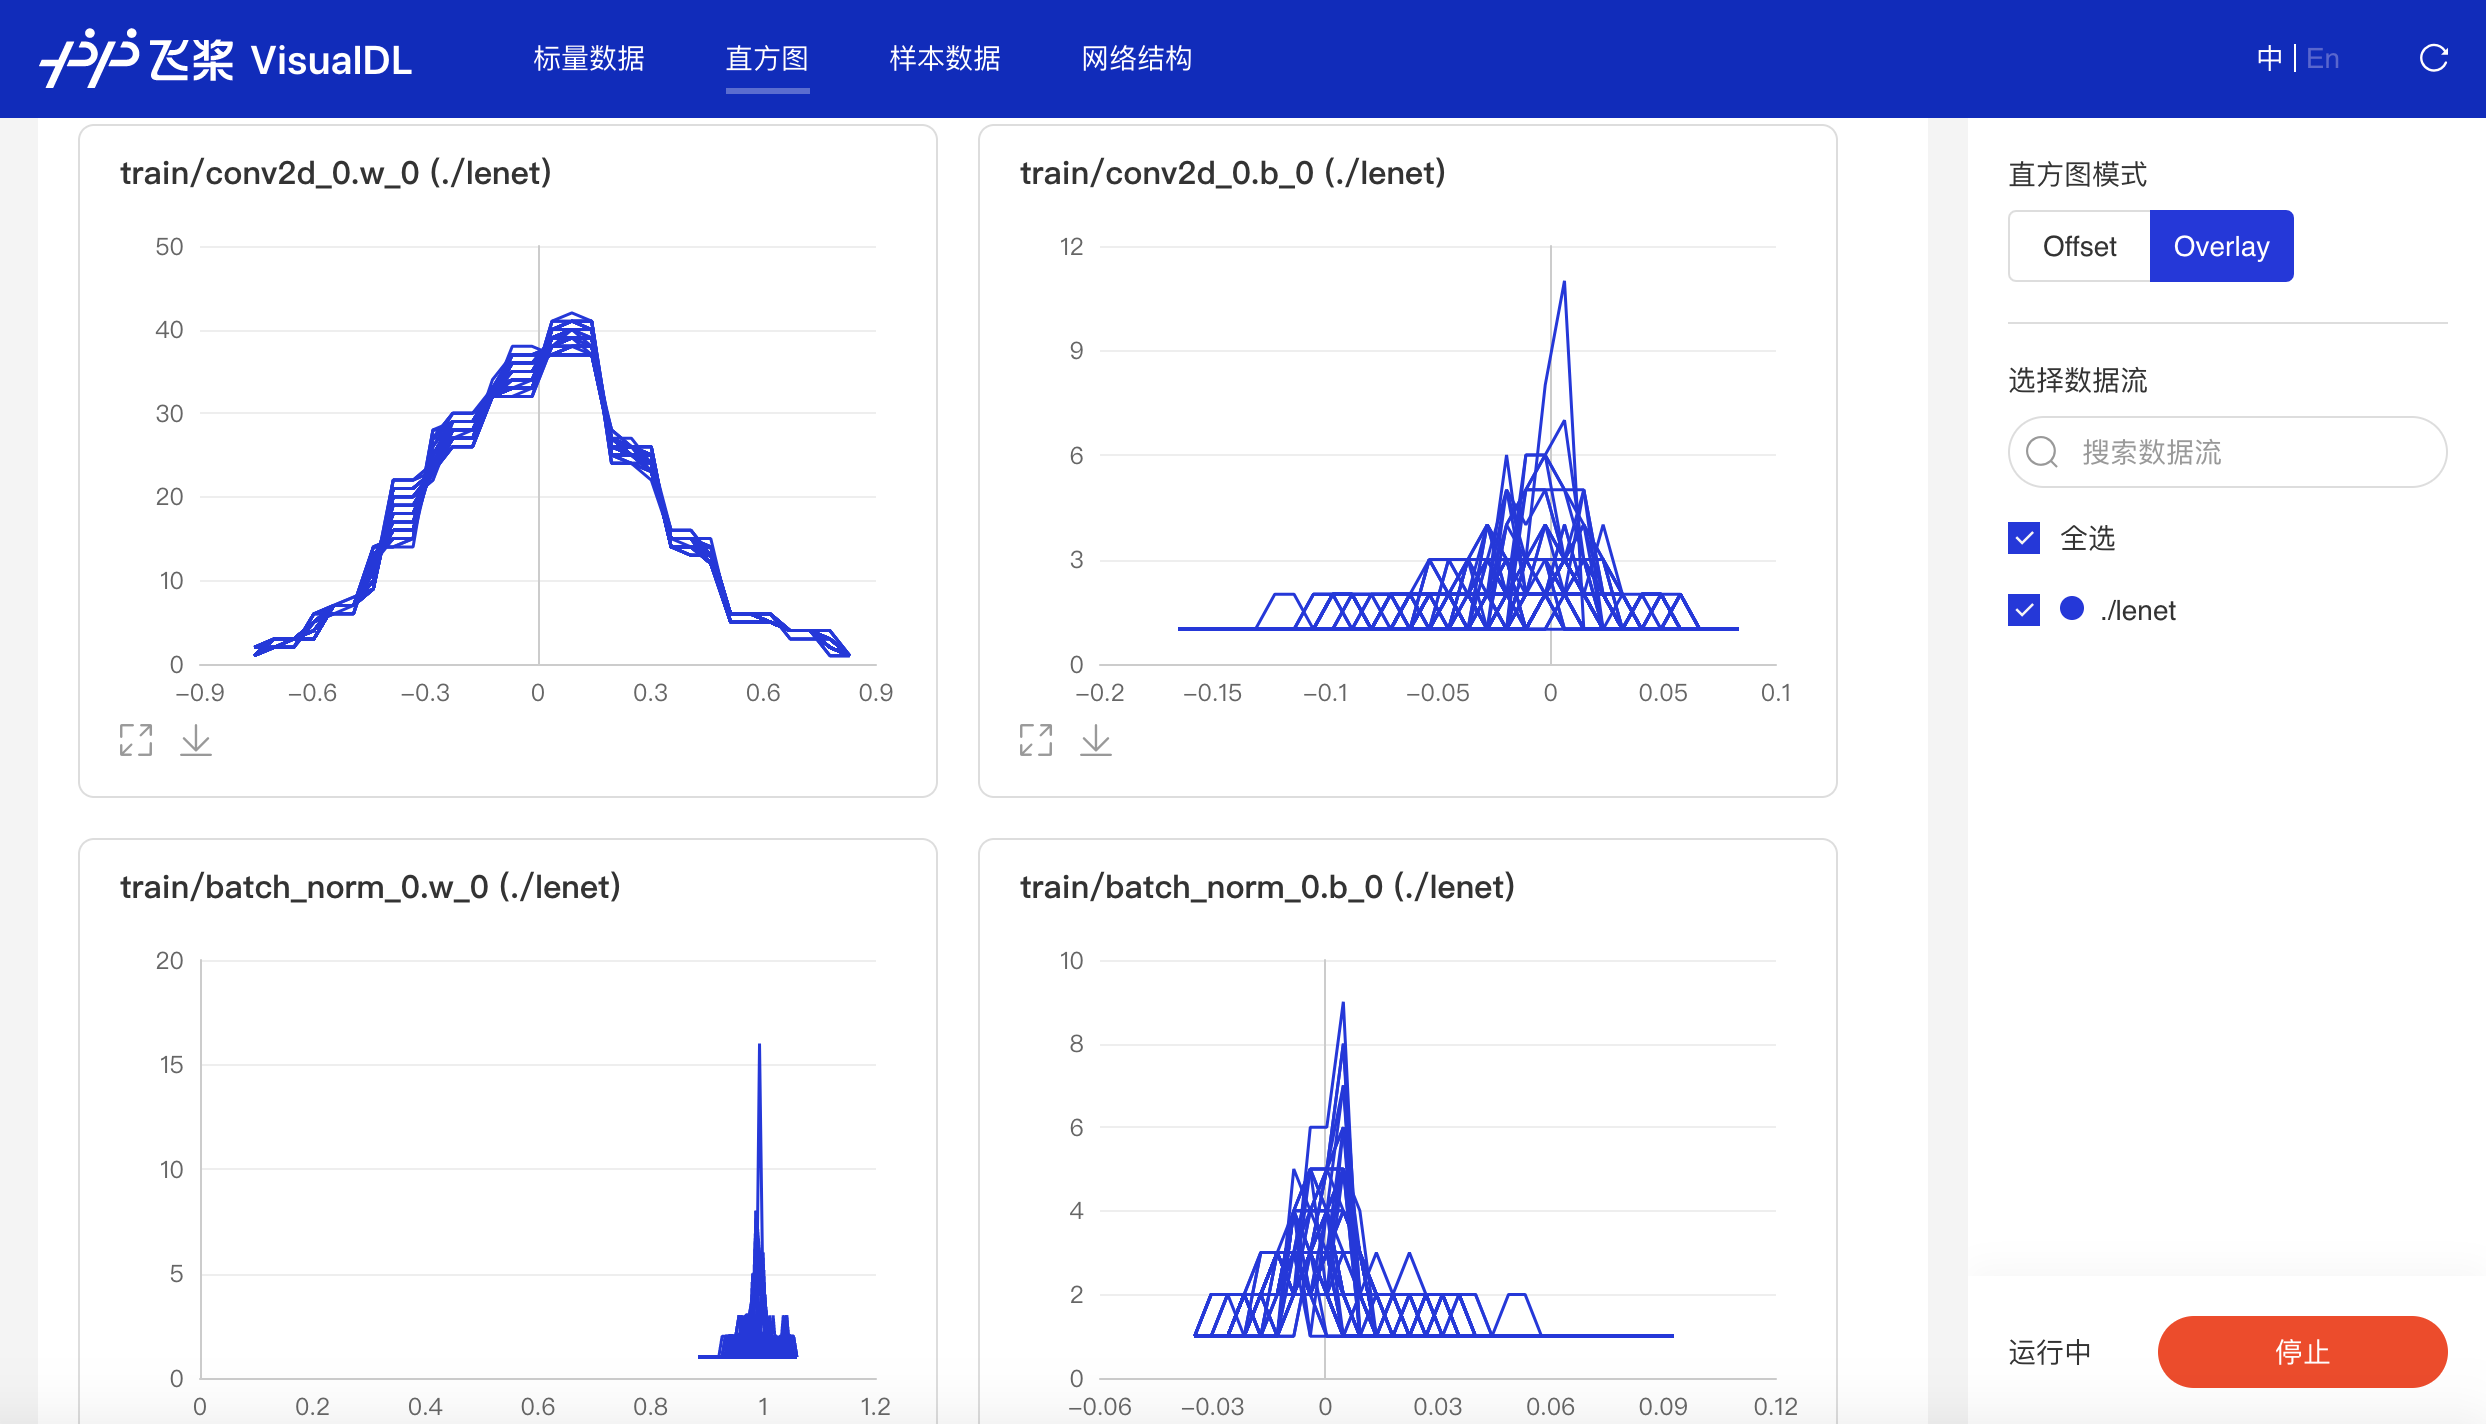
### Histogram
Histogram displays how the trend of tensors (weight, bias, gradient, etc.) changes during the training process in the form of histogram. Developers can adjust the model structures accurately by having an in-depth understanding of the effect of each layer.
- Offset Mode

- Overlay Mode
### High Dimensional
**High Dimensional** provides two approaches--T-SNE and PCA--to do the dimensionality reduction, allowing developers to have an in-depth analysis of the relationship between high-dimensional data and to optimize algorithms based on the analysis.

## Contribution
VisualDL, in which Graph is powered by [Netron](https://github.com/lutzroeder/netron), is an open source project supported by [PaddlePaddle](https://www.paddlepaddle.org/) and [ECharts](https://echarts.apache.org/) . Developers are warmly welcomed to use, comment and contribute.
## More Details
For more details related to the use of VisualDL, please refer to [**VisualDL User Guide**](./docs/components/README.md)。
## Technical Communication
Welcome to join the official QQ group 104578336 to communicate with PaddlePaddle team and other developers.
