[](https://travis-ci.org/PaddlePaddle/VisualDL)
[](https://github.com/PaddlePaddle/VisualDL/tree/develop/docs)
[](https://github.com/PaddlePaddle/VisualDL/releases)
[](LICENSE)

#
## 介绍
VisualDL是一个面向深度学习任务设计的可视化工具,包含了scalar、参数分布、模型结构、图像可视化等功能,项目正处于高速迭代中,新的组件会不断加入。
目前大多数DNN平台均使用Python作为配置语言,VisualDL原生支持python的使用,
通过在模型的Python配置中添加几行,便可以为训练过程提供丰富的可视化支持。
除了Python SDK之外,VisualDL底层采用C++编写,其暴露的C++ SDK也可以集成到其他平台中,
实现原生的性能和定制效果。
## 组件
VisualDL 目前支持4种组件:
- graph
- scalar
- image
- histogram
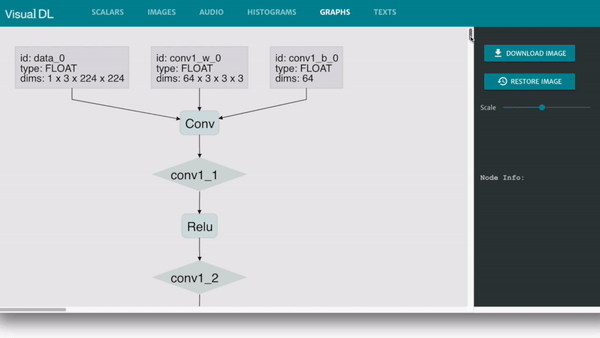
### graph
兼容 ONNX(Open Neural Network Exchange)[https://github.com/onnx/onnx], 通过与 python SDK的结合,VisualDL可以兼容包括 PaddlePaddle, pytorch, mxnet在内的大部分主流DNN平台。
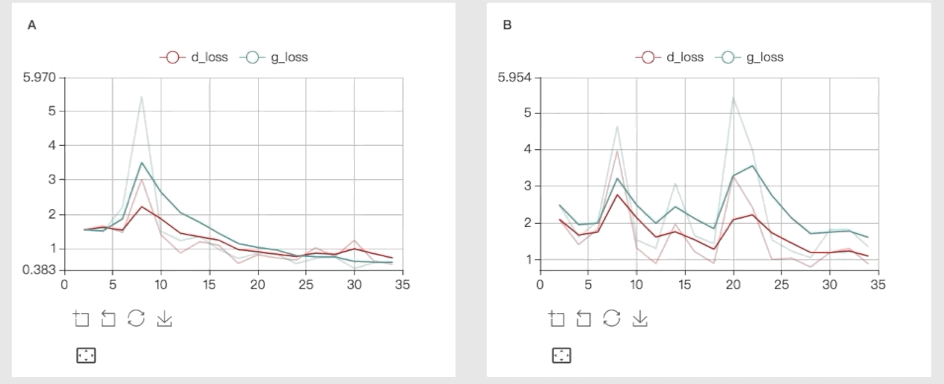
### scalar
可以用于展示训练测试的误差趋势
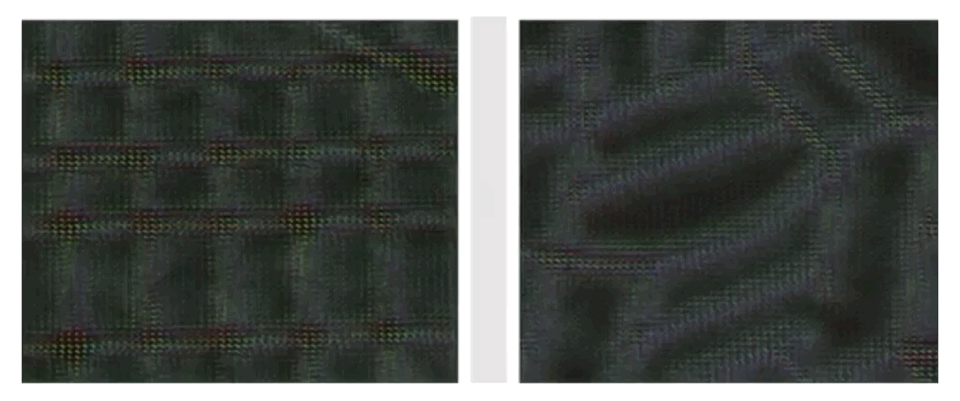
### image
可以用于可视化任何tensor,或模型生成的图片
### histogram
用于可视化任何tensor中元素分布的变化趋势

## 快速尝试
请使用下面的命令,来快速测试 VisualDL。
```
# 安装,建議是在虛擬環境下。
pip install --upgrade visualdl
# 运行一个例子,vdl_create_scratch_log 将创建测试日志
vdl_create_scratch_log
visualDL --logdir=scratch_log --port=8080
# 访问 http://127.0.0.1:8080
```
## SDK
VisualDL 同时提供了python SDK 和 C++ SDK 来实现不同方式的使用。
### Python SDK
VisualDL 现在支持 Python 2和 Python 3。
以最简单的Scalar组件为例,尝试创建一个scalar组件并插入多个时间步的数据:
```python
import random
from visualdl import LogWriter
logdir = "./tmp"
logger = LogWriter(logdir, sync_cycle=10000)
# mark the components with 'train' label.
with logger.mode("train"):
# create a scalar component called 'scalars/scalar0'
scalar0 = logger.scalar("scalars/scalar0")
# add some records during DL model running.
for step in range(100):
scalar0.add_record(step, random.random())
```
### C++ SDK
上面 Python SDK 中代码完全一致的C++ SDK用法如下
```c++
#include
#include
#include "visualdl/sdk.h"
namespace vs = visualdl;
namespace cp = visualdl::components;
int main() {
const std::string dir = "./tmp";
vs::LogWriter logger(dir, 10000);
logger.SetMode("train");
auto tablet = logger.AddTablet("scalars/scalar0");
cp::Scalar scalar0(tablet);
for (int step = 0; step < 1000; step++) {
float v = (float)std::rand() / RAND_MAX;
scalar0.AddRecord(step, v);
}
return 0;
}
```
## 启动Board
当训练过程中已经产生了日志数据,就可以启动board进行实时预览可视化信息
```
visualDL --logdir
```
board 还支持一下参数来实现远程的访问:
- `--host` 设定IP
- `--port` 设定端口
- `--model_pb` 指定 ONNX 格式的模型文件
VisualDL的图形系统采用` GraphViz `来可视化ONNX格式模型。
请安装 [GraphViz](https://www.graphviz.org/download/)确保VisualDL图形系统可以启动
### 贡献
VisualDL 是由 [PaddlePaddle](http://www.paddlepaddle.org/) 和
[ECharts](http://echarts.baidu.com/) 合作推出的开源项目。我们欢迎所有人使用,提意见以及贡献代码。