```
Parameter details:
| parameters | meaning |
| --------------- | ------------------------------------------------------------ |
| --logdir | Set one or more directories of the log. VisualDL will search the log file recursively under this path to display the all experimental results. |
| --host | Specify IP address. The default value is·`127.0.0.1`. |
| --port | Set the port. The default value is`8040`. |
| --cache-timeout | Cache time of the backend. During the cache time, the front end requests the same URL multiple times, and then the returned data is obtained from the cache. The default cache time is 20 seconds. |
| --language | The language of the VisualDL panel. Language can be specified as 'en' or 'zh', and the default is the language used by the browser. |
| --public-path | The URL path of the VisualDL panel. The default path is '/app', meaning that the access address is 'http://<host>:<port>/app'. |
| --api-only | Decide whether or not to provide only API. If this parameter is set, VisualDL will only provides API service without displaying the web page, and the API address is 'http://<host>:<port>/<public_path>/api'. Additionally, If the public_path parameter is not specified, the default address is 'http://<host>:<port>/api'. |
| --component_tabs | Decide which components are presented in page, currently support 15 components, i.e. 'scalar', 'image', 'text', 'embeddings', 'audio', 'histogram', 'hyper_parameters', 'static_graph', 'dynamic_graph', 'pr_curve', 'roc_curve', 'profiler', 'x2paddle', 'fastdeploy_server', 'fastdeploy_client'. If this parameter is set, only specified components will be presented. If not set, and specify --logdir parameter, only components with data in vdlrecords log are presented. If both --component_tabs and --logdir are not set, only present 'static_graph', 'x2paddle', 'fastdeploy_server', 'fastdeploy_client' components by default |
To visualize the log file generated in the previous step, developers can launch the panel through the command:
```
visualdl --logdir ./log
```
#### Launch in Python Script
Developers can start the VisualDL panel in Python script as follows:
```python
visualdl.server.app.run(logdir,
host="127.0.0.1",
port=8080,
cache_timeout=20,
language=None,
public_path=None,
api_only=False,
open_browser=False)
```
Please note: since all parameters are indefinite except `logdir`, developers should specify parameter names when using them.
The interface parameters are as follows:
| parameters | type | meaning |
| ------------- | -------------------------------------------------- | ------------------------------------------------------------ |
| logdir | string or list[string_1, string_2, ... , string_n] | Set one or more directories of the log. VisualDL will search the log file recursively under this path to display the all experimental results. |
| host | string | Specify IP address. The default value is·`127.0.0.1`. |
| port | int | Set the port. The default value is`8040`. |
| cache_timeout | int | Cache time of the backend. During the cache time, the front end requests the same URL multiple times, and then the returned data is obtained from the cache. The default cache time is 20 seconds. |
| language | string | The language of the VisualDL panel. Language can be specified as 'en' or 'zh', and the default is the language used by the browser. |
| public_path | string | The URL path of the VisualDL panel. The default path is '/app', meaning that the access address is 'http://<host>:<port>/app'. |
| api_only | boolean | Decide whether or not to provide only API. If this parameter is set, VisualDL will only provides API service without displaying the web page, and the API address is 'http://<host>:<port>/<public_path>/api'. Additionally, If the parameter public_path is not specified, the default address is 'http://<host>:<port>/api'. |
| open_browser | boolean | Whether or not to open the browser. If this parameter is set as True, the browser will be openned automatically and VisualDL panel will be launched at the same time. If parameter api_only is specified as True, parameter open_browser can be ignored. |
| component_tabs | string or list[string_1, string_2, ... , string_n] | Decide which components are presented in page, currently support 15 components, i.e. 'scalar', 'image', 'text', 'embeddings', 'audio', 'histogram', 'hyper_parameters', 'static_graph', 'dynamic_graph', 'pr_curve', 'roc_curve', 'profiler', 'x2paddle', 'fastdeploy_server', 'fastdeploy_client'. If this parameter is set, only specified components will be presented. If not set, and specify --logdir parameter, only components with data in vdlrecords log are presented. If both --component_tabs and --logdir are not set, only present 'static_graph', 'x2paddle', 'fastdeploy_server', 'fastdeploy_client' components by default |
To visualize the log file generated in the previous step, developers can launch the panel through the command:
```python
from visualdl.server import app
app.run(logdir="./log")
```
After launching the panel by one of the above methods, developers can see the visualization results on the browser shown as blow:

## Function Preview
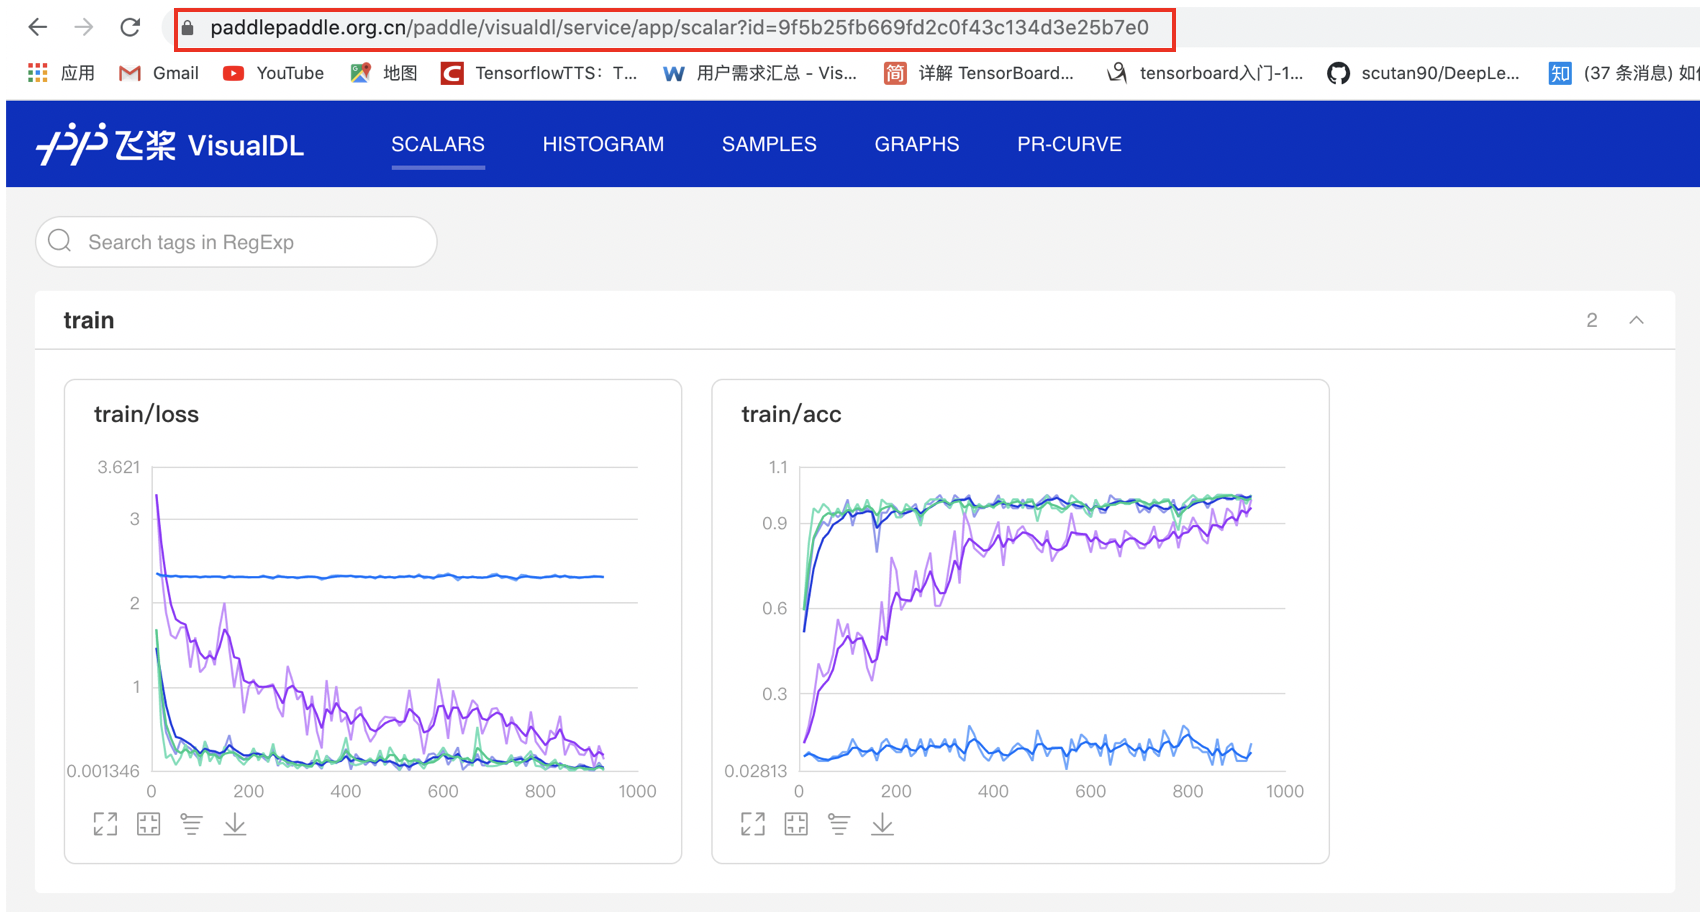
### Scalar
**Scalar** makes use of various charts to display how the parameters, such as accuracy, loss and learning rate, change during the training process. In this case, developers can observe not only the single but also the multiple groups of parameters in order to understand the training process and thus speed up the process of model tuning.
#### Dynamic Display
After the launchment of VisualDL Board, the LogReader will continuously record the data to display in the front-end. Hence, the changes of parameters can be visualized in real-time, as shown below:
#### Comparison of Multiple Experiments
Developers can compare with multiple experiments by specifying and uploading the path of each experiment at the same time so as to visualize the same parameters in the same chart.

### Image
**Image** provides real-time visualizations of the image data during the training process, allowing developers to observe the changes of images in different training stages and to deeply understand the effects of the training process.

### Audio
**Audio** aims to allow developers to listen to the audio data in real-time during the training process, helping developers to monitor the process of speech recognition and text-to-speech.

### Text
**Text** visualizes the text output of NLP models within any stage, aiding developers to compare the changes of outputs so as to deeply understand the training process and simply evaluate the performance of the model.

### Graph
**Graph** enables developers to visualize model structures by only one click. Moreover, **Graph** allows developers to explore model attributes, node information, node input and output. aiding them analyze model structures quickly and understand the direction of data flow easily. Additionally, Graph supports the visualization of dynamic and static model graph respectively.
- dynamic graph

- static graph

### Histogram
**Histogram** displays how the trend of tensors (weight, bias, gradient, etc.) changes during the training process in the form of histogram. Developers can adjust the model structures accurately by having an in-depth understanding of the effect of each layer.
- Offset Mode

- Overlay Mode

### High Dimensional
**High Dimensional** provides two approaches--T-SNE and PCA--to do the dimensionality reduction, allowing developers to have an in-depth analysis of the relationship between high-dimensional data and to optimize algorithms based on the analysis.
### Hyper Parameters
**Hyper Parameters** visualize the relationship between hyperparameters and model metrics (such as accuracy and loss) in a rich view, helping you identify the best hyperparameters in an efficient way.

### Performance Analysis
**Performance Analysis**(Profiler) visualize the profiling data collected during your program runs, helping you identify program bottlenecks and optimize performance. Please refer to [VisualDL Profiler Guide](./components/profiler/README.md).
### X2Paddle
The X2Paddle component provides the functions of onnx model format visualization and transformation to paddle format.

### FastDeployServer
The FastDeployServer component provides the functions of loading and editing the model repository, fastdeployserver service management and monitoring, and providing the client to test service. Please refer to [use VisualDL for fastdeploy serving deployment visualization](./components/fastdeploy_server/README.md).

### FastDeployClient
The FastDeployClient component is mainly used to quickly access the fastdeployserver service, to help users visualize prediction requests and results. Please refer to [use VisualDL as fastdeploy client for request visualization](./components/fastdeploy_client/README.md).

### VDL.service
**VDL.service** enables developers to easily save, track and share visualization results with anyone for free.
 ## Contribution
VisualDL, in which Graph is powered by [Netron](https://github.com/lutzroeder/netron), is an open source project supported by [PaddlePaddle](https://www.paddlepaddle.org/) and [ECharts](https://echarts.apache.org/) . Developers are warmly welcomed to use, comment and contribute.
## More Details
For more details related to the use of VisualDL, please refer to [**VisualDL User Guide**](./components/README.md), [**VisualDL Profiler Guide**](./components/profiler/README.md), [**Use VisualDL for fastdeploy serving deployment visualization**](./components/fastdeploy_server/README.md), [**Use VisualDL as fastdeploy client for request visualization**](./components/fastdeploy_client/README.md).
## Technical Communication
Welcome to join the official QQ group 104578336 to communicate with PaddlePaddle team and other developers.
## Contribution
VisualDL, in which Graph is powered by [Netron](https://github.com/lutzroeder/netron), is an open source project supported by [PaddlePaddle](https://www.paddlepaddle.org/) and [ECharts](https://echarts.apache.org/) . Developers are warmly welcomed to use, comment and contribute.
## More Details
For more details related to the use of VisualDL, please refer to [**VisualDL User Guide**](./components/README.md), [**VisualDL Profiler Guide**](./components/profiler/README.md), [**Use VisualDL for fastdeploy serving deployment visualization**](./components/fastdeploy_server/README.md), [**Use VisualDL as fastdeploy client for request visualization**](./components/fastdeploy_client/README.md).
## Technical Communication
Welcome to join the official QQ group 104578336 to communicate with PaddlePaddle team and other developers.


