# CanvasRenderingContext2D
> **NOTE**
>
> This component is supported since API version 4. Updates will be marked with a superscript to indicate their earliest API version.
**CanvasRenderingContext2D** allows you to draw rectangles, text, images, and other objects on a canvas.
**Example**
```html
```
```js
// xxx.js
export default {
handleClick() {
const el = this.$refs.canvas1;
const ctx = el.getContext('2d');
ctx.beginPath();
ctx.arc(100, 75, 50, 0, 6.28);
ctx.stroke();
},
antialias() {
const el = this.$refs.canvas1;
const ctx = el.getContext('2d', { antialias: true });
ctx.beginPath();
ctx.arc(100, 75, 50, 0, 6.28);
ctx.stroke();
}
}
```
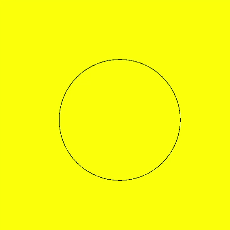
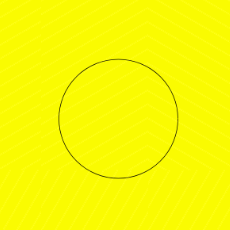
- Anti-aliasing disabled
- Anti-aliasing enabled
## Attributes
| Name | Type | Description |
| ---------------------------------------- | ---------------------------------------- | ---------------------------------------- |
| [fillStyle](#fillstyle) | <color> \| [CanvasGradient](../arkui-js/js-components-canvas-canvasgradient.md) \| CanvasPattern | Style to fill an area. - When the type is **\**, this parameter indicates the color of the filling area. - When the type is **CanvasGradient**, this parameter indicates a gradient object, which is created using the **createLinearGradient()** method. - When the type is **CanvasPattern**, this parameter indicates a canvas pattern, which is created using the **createPattern()** method.|
| [lineWidth](#linewidth) | number | Line width. |
| [strokeStyle](#strokestyle) | <color> \| [CanvasGradient](../arkui-js/js-components-canvas-canvasgradient.md) \| CanvasPattern | Stroke style. - When the type is **\**, this parameter indicates the stroke color. - When the type is **CanvasGradient**, this parameter indicates a gradient object, which is created using the **createLinearGradient()** method. - When the type is **CanvasPattern**, this parameter indicates a canvas pattern, which is created using the **createPattern()** method.|
| [lineCap](#linecap) | string | Style of the specified line endpoint. The options are as follows: - **butt**: The endpoints of the line are squared off. - **round**: The endpoints of the line are rounded. - **square**: The endpoints of the line are squared off, and each endpoint has added a rectangle whose length is the same as the line thickness and whose width is half of the line thickness. Default value: **butt**|
| [lineJoin](#linejoin) | string | Style of the intersection point between line segments. The options are as follows: - **round**: The intersection is a sector, whose radius at the rounded corner is equal to the line width. - **bevel**: The intersection is a triangle. The rectangular corner of each line is independent. - **miter**: The intersection has a miter corner by extending the outside edges of the lines until they meet. You can view the effect of this attribute in **miterLimit**. Default value: **miter**|
| [miterLimit](#miterlimit) | number | Maximum miter length. The miter length is the distance between the inner corner and the outer corner where two lines meet. Default value: **10** |
| [font](#font) | string | Font style. Syntax: ctx.font="font-style font-weight font-size font-family"5+ - (Optional) **font-style**: font style. Available values are **normal** and **italic**. - (Optional) **font-weight**: font weight. Available values are as follows: **normal**, **bold**, **bolder**, **lighter**, **100**, **200**, **300**, **400**, **500**, **600**, **700**, **800**, **900**. - (Optional) **font-size**: font size and row height. The unit can only be pixels. - (Optional) **font-family**: font family. Available values are **sans-serif**, **serif**, and **monospace**. Default value: **"normal normal 14px sans-serif"**|
| [textAlign](#textalign) | string | Text alignment mode. Available values are as follows: - **left**: The text is left-aligned. - **right**: The text is right-aligned. - **center**: The text is center-aligned. - **start**: The text is aligned with the start bound. - **end**: The text is aligned with the end bound. In the **ltr** layout mode, the value **start** equals **left**. In the **rtl** layout mode, the value **start** equals **right**. Default value: **left**|
| [textBaseline](#textbaseline) | string | Horizontal alignment mode of text. Available values are as follows: - **alphabetic**: The text baseline is the normal alphabetic baseline. - **top**: The text baseline is on the top of the text bounding box. - **hanging**: The text baseline is a hanging baseline over the text. - **middle**: The text baseline is in the middle of the text bounding box. - **ideographic**: The text baseline is the ideographic baseline. If a character exceeds the alphabetic baseline, the ideographic baseline is located at the bottom of the excessive character. - **bottom**: The text baseline is at the bottom of the text bounding box. Its difference from the ideographic baseline is that the ideographic baseline does not consider letters in the next line. Default value: **alphabetic**|
| [globalAlpha](#globalalpha) | number | Opacity. **0.0**: completely transparent. **1.0**: completely opaque. |
| [lineDashOffset](#linedashoffset) | number | Offset of the dashed line. The precision is float. Default value: **0.0** |
| [globalCompositeOperation](#globalcompositeoperation) | string | Composition operation type. Available values are as follows: **source-over**, **source-atop**, **source-in**, **source-out**, **destination-over**, **destination-atop**, **destination-in**, **destination-out**, **lighter**, copy, and **xor**. For details, see [Operation types](#globalcompositeoperation). Default value: **ource-over**|
| [shadowBlur](#shadowblur) | number | Blur level during shadow drawing. A larger value indicates a more blurred effect. The precision is float. Default value: **0.0**|
| [shadowColor](#shadowcolor) | <color> | Shadow color. |
| [shadowOffsetX](#shadowoffsetx) | number | X-axis shadow offset relative to the original object. |
| [shadowOffsetY](#shadowoffsety) | number | Y-axis shadow offset relative to the original object. |
| [imageSmoothingEnabled](#imagesmoothingenabled6)6+ | boolean | Whether to adjust the image smoothness during image drawing. The value **true** means to enable this feature, and **false** means the opposite. Default value: **true**|
### fillStyle
```html
```
```js
// xxx.js
export default {
onShow() {
const el =this.$refs.canvas;
const ctx = el.getContext('2d');
ctx.arc(100, 75, 50, 0, 6.28);
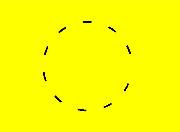
ctx.setLineDash([10,20]);
ctx.lineDashOffset = 10.0;
ctx.stroke();
}
}
```
### globalCompositeOperation
Enumerates the operation types.
| Value | Description |
| ---------------- | ------------------------ |
| source-over | Displays the new drawing above the existing drawing. This attribute is used by default. |
| source-atop | Displays the new drawing on the top of the existing drawing. |
| source-in | Displays the new drawing inside the existing drawing. |
| source-out | Displays part of the new drawing that is outside of the existing drawing. |
| destination-over | Displays the existing drawing above the new drawing. |
| destination-atop | Displays the existing drawing on the top of the new drawing. |
| destination-in | Displays the existing drawing inside the new drawing. |
| destination-out | Displays the existing drawing outside the new drawing. |
| lighter | Displays both the new and existing drawing. |
| copy | Displays the new drawing and neglects the existing drawing. |
| xor | Combines the new drawing and existing drawing using the XOR operation.|
**Example**
```html
```
```js
// xxx.js
export default {
onShow() {
const el =this.$refs.canvas;
const ctx = el.getContext('2d');
ctx.fillStyle = 'rgb(255,0,0)';
ctx.fillRect(20, 20, 50, 50);
ctx.globalCompositeOperation = 'source-over';
ctx.fillStyle = 'rgb(0,0,255)';
ctx.fillRect(50, 50, 50, 50);
// Start drawing second example
ctx.fillStyle = 'rgb(255,0,0)';
ctx.fillRect(120, 20, 50, 50);
ctx.globalCompositeOperation = 'destination-over';
ctx.fillStyle = 'rgb(0,0,255)';
ctx.fillRect(150, 50, 50, 50);
}
}
```

In the above example, the blue rectangle represents the new drawing, and the red rectangle represents the existing drawing.
### shadowBlur
```html
```
```js
// xxx.js
export default {
onShow() {
const el =this.$refs.canvas;
const ctx = el.getContext('2d');
var img = new Image();
img.src = 'common/image/example.jpg';
img.onload = function() {
ctx.imageSmoothingEnabled = false;
ctx.drawImage(img, 0, 0, 400, 200);
};
}
}
```
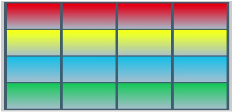
## Methods
### fillRect
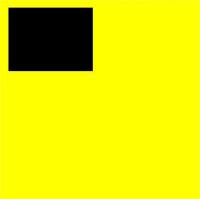
fillRect(x: number, y: number, width:number, height: number): void
Fills a rectangle on the canvas.
**Parameters**
| Name | Type | Description |
| ------ | ------ | ------------- |
| x | number | X-coordinate of the upper left corner of the rectangle.|
| y | number | Y-coordinate of the upper left corner of the rectangle.|
| width | number | Width of the rectangle. |
| height | number | Height of the rectangle. |
**Example**
```html
```
```js
//xxx.js
export default {
onShow() {
const el =this.$refs.canvas;
const ctx = el.getContext('2d');
ctx.fillRect(20, 20, 200, 150);
}
}
```
### clearRect
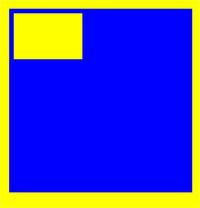
clearRect(x: number, y: number, width:number, height: number): void
Clears the content in a rectangle on the canvas.
**Parameters**
| Name | Type | Description |
| ------ | ------ | ------------- |
| x | number | X-coordinate of the upper left corner of the rectangle.|
| y | number | Y-coordinate of the upper left corner of the rectangle.|
| width | number | Width of the rectangle. |
| height | number | Height of the rectangle. |
**Example**
```html
```
```js
//xxx.js
export default {
onShow() {
const el =this.$refs.canvas;
const ctx = el.getContext('2d');
ctx.fillStyle = 'rgb(0,0,255)';
ctx.fillRect(0, 0, 400, 200);
ctx.clearRect(20, 20, 150, 100);
}
}
```
### strokeRect
strokeRect(x: number, y: number, width:number, height: number): void
Draws a rectangle stroke on the canvas.
**Parameters**
| Name | Type | Description |
| ------ | ------ | ------------ |
| x | number | X-coordinate of the upper left corner of the rectangle stroke.|
| y | number | Y-coordinate of the upper left corner of the rectangle stroke.|
| width | number | Width of the rectangle. |
| height | number | Height of the rectangle. |
**Example**
```html
```
```js
//xxx.js
export default {
onShow() {
const el =this.$refs.canvas;
const ctx = el.getContext('2d');
ctx.strokeRect(30, 30, 200, 150);
}
}
```
### fillText
fillText(text: string, x: number, y: number): void
Draws filled text on the canvas.
**Parameters**
| Name | Type | Description |
| ---- | ------ | --------------- |
| text | string | Text to draw. |
| x | number | X-coordinate of the lower left corner of the text.|
| y | number | Y-coordinate of the lower left corner of the text.|
**Example**
```html
```
```js
//xxx.js
export default {
onShow() {
const el =this.$refs.canvas;
const ctx = el.getContext('2d');
ctx.font = '35px sans-serif';
ctx.fillText("Hello World!", 10, 60);
}
}
```

### strokeText
strokeText(text: string, x: number, y: number): void
Draws a text stroke on the canvas.
**Parameters**
| Name | Type | Description |
| ---- | ------ | --------------- |
| text | string | Text to draw. |
| x | number | X-coordinate of the lower left corner of the text.|
| y | number | Y-coordinate of the lower left corner of the text.|
**Example**
```html
```
```js
//xxx.js
export default {
onShow() {
const el =this.$refs.canvas;
const ctx = el.getContext('2d');
ctx.font = '25px sans-serif';
ctx.strokeText("Hello World!", 10, 60);
}
}
```

### measureText
measureText(text: string): TextMetrics
Returns a **TextMetrics** object used to obtain the width of specified text.
**Parameters**
| Name | Type | Description |
| ---- | ------ | ---------- |
| text | string | Text to be measured.|
**Return value**
| Type | Description |
| ----------- | -------------------------------------- |
| TextMetrics | Object that contains the text width. You can obtain the width by **TextMetrics.width**.|
**Example**
```html
```
```js
//xxx.js
export default {
onShow() {
const el =this.$refs.canvas;
const ctx = el.getContext('2d');
ctx.beginPath();
ctx.lineWidth = '6';
ctx.strokeStyle = '#0000ff';
ctx.moveTo(15, 80);
ctx.lineTo(280, 80);
ctx.stroke();
}
}
```

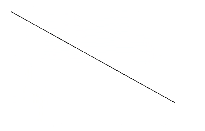
### moveTo
moveTo(x: number, y: number): void
Moves a drawing path to a target position on the canvas.
**Parameters**
| Name | Type | Description |
| ---- | ------ | --------- |
| x | number | X-coordinate of the target position.|
| y | number | Y-coordinate of the target position.|
**Example**
```html
```
```js
//xxx.js
export default {
onShow() {
const el =this.$refs.canvas;
const ctx = el.getContext('2d');
ctx.beginPath();
ctx.moveTo(10, 10);
ctx.lineTo(280, 160);
ctx.stroke();
}
}
```
### lineTo
lineTo(x: number, y: number): void
Connects the current point to a target position using a straight line.
**Parameters**
| Name | Type | Description |
| ---- | ------ | --------- |
| x | number | X-coordinate of the target position.|
| y | number | Y-coordinate of the target position.|
**Example**
```html
```
```js
//xxx.js
export default {
onShow() {
const el =this.$refs.canvas;
const ctx = el.getContext('2d');
ctx.beginPath();
ctx.moveTo(30, 30);
ctx.lineTo(110, 30);
ctx.lineTo(70, 90);
ctx.closePath();
ctx.stroke();
}
}
```

### createPattern
createPattern(image: Image, repetition: string): Object
Creates a pattern for image filling based on a specified source image and repetition mode.
**Parameters**
| Name | Type | Description |
| ---------- | ------ | ---------------------------------------- |
| image | Image | Source image. For details, see [Image](../arkui-js/js-components-canvas-image.md).|
| repetition | string | Repetition mode. The value can be **"repeat"**, **"repeat-x"**, **"repeat-y"**, or **"no-repeat"**.|
**Return value**
| Type | Description |
| ------ | ----------------- |
| Object | Pattern of image filling.|
**Example**
```html
```
```js
//xxx.js
export default {
onShow() {
const el =this.$refs.canvas;
const ctx = el.getContext('2d');
var img = new Image();
img.src = 'common/images/example.jpg';
var pat = ctx.createPattern(img, 'repeat');
ctx.fillStyle = pat;
ctx.fillRect(0, 0, 500, 500);
}
}
```

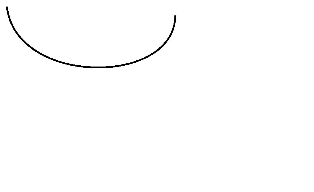
### bezierCurveTo
bezierCurveTo(cp1x: number, cp1y: number, cp2x: number, cp2y: number, x: number, y: number): void
Draws a cubic bezier curve on the canvas.
**Parameters**
| Name | Type | Description |
| ---- | ------ | -------------- |
| cp1x | number | X-coordinate of the first parameter of the bezier curve.|
| cp1y | number | Y-coordinate of the first parameter of the bezier curve.|
| cp2x | number | X-coordinate of the second parameter of the bezier curve.|
| cp2y | number | Y-coordinate of the second parameter of the bezier curve.|
| x | number | X-coordinate of the end point on the bezier curve. |
| y | number | Y-coordinate of the end point on the bezier curve. |
**Example**
```html
```
```js
//xxx.js
export default {
onShow() {
const el =this.$refs.canvas;
const ctx = el.getContext('2d');
ctx.beginPath();
ctx.moveTo(10, 10);
ctx.bezierCurveTo(20, 100, 200, 100, 200, 20);
ctx.stroke();
}
}
```
### quadraticCurveTo
quadraticCurveTo(cpx: number, cpy: number, x: number, y: number): void
Draws a quadratic curve on the canvas.
**Parameters**
| Name | Type | Description |
| ---- | ------ | ----------- |
| cpx | number | X-coordinate of the bezier curve parameter.|
| cpy | number | Y-coordinate of the bezier curve parameter.|
| x | number | X-coordinate of the end point on the bezier curve.|
| y | number | Y-coordinate of the end point on the bezier curve.|
**Example**
```html
```
```js
//xxx.js
export default {
onShow() {
const el =this.$refs.canvas;
const ctx = el.getContext('2d');
ctx.beginPath();
ctx.moveTo(20, 20);
ctx.quadraticCurveTo(100, 100, 200, 20);
ctx.stroke();
}
}
```
### arc
arc(x: number, y: number, radius: number, startAngle: number, endAngle: number, anticlockwise: boolean): void
Draws an arc on the canvas.
**Parameters**
| Name | Type | Description |
| ------------- | ------- | ---------- |
| x | number | X-coordinate of the center point of the arc.|
| y | number | Y-coordinate of the center point of the arc.|
| radius | number | Radius of the arc. |
| startAngle | number | Start radian of the arc. |
| endAngle | number | End radian of the arc. |
| anticlockwise | boolean | Whether to draw the arc counterclockwise.|
**Example**
```html
```
```js
//xxx.js
export default {
onShow() {
const el =this.$refs.canvas;
const ctx = el.getContext('2d');
ctx.beginPath();
ctx.arc(100, 75, 50, 0, 6.28);
ctx.stroke();
}
}
```

### arcTo
arcTo(x1: number, y1: number, x2: number, y2: number, radius: number): void
Draws an arc based on the radius and points on the arc.
**Parameters**
| Name | Type | Description |
| ------ | ------ | --------------- |
| x1 | number | X-coordinate of the first point on the arc.|
| y1 | number | Y-coordinate of the first point on the arc.|
| x2 | number | X-coordinate of the second point on the arc.|
| y2 | number | Y-coordinate of the second point on the arc.|
| radius | number | Radius of the arc. |
**Example**
```html
```
```js
//xxx.js
export default {
onShow() {
const el =this.$refs.canvas;
const ctx = el.getContext('2d');
ctx.moveTo(100, 20);
ctx.arcTo(150, 20, 150, 70, 50); // Create an arc
ctx.stroke();
}
}
```

### ellipse6+
ellipse(x: number, y: number, radiusX: number, radiusY: number, rotation: number, startAngle: number, endAngle: number, anticlockwise: number): void
Draws an ellipse in the specified rectangular region on the canvas.
**Parameters**
| Name | Type | Description |
| ------------- | ------ | ------------------------------------ |
| x | number | X-coordinate of the ellipse center. |
| y | number | Y-coordinate of the ellipse center. |
| radiusX | number | Ellipse radius on the x-axis. |
| radiusY | number | Ellipse radius on the y-axis. |
| rotation | number | Rotation angle of the ellipse. The unit is radian. |
| startAngle | number | Angle of the start point for drawing the ellipse. The unit is radian. |
| endAngle | number | Angle of the end point for drawing the ellipse. The unit is radian. |
| anticlockwise | number | Whether to draw the ellipse counterclockwise. The value **0** means clockwise, and **1** means counterclockwise. This parameter is optional. The default value is **0**.|
**Example**
```html
```
```js
//xxx.js
export default {
onShow() {
const el =this.$refs.canvas;
const ctx = el.getContext('2d');
ctx.beginPath();
ctx.ellipse(200, 200, 50, 100, Math.PI * 0.25, Math.PI * 0.5, Math.PI, 1);
ctx.stroke();
}
}
```

### rect
rect(x: number, y: number, width: number, height: number): void
Creates a rectangle on the canvas.
**Parameters**
| Name | Type | Description |
| ------ | ------ | ------------- |
| x | number | X-coordinate of the upper left corner of the rectangle.|
| y | number | Y-coordinate of the upper left corner of the rectangle.|
| width | number | Width of the rectangle. |
| height | number | Height of the rectangle. |
**Example**
```html
```
```js
//xxx.js
export default {
onShow() {
const el =this.$refs.canvas;
const ctx = el.getContext('2d');
ctx.rect(20, 20, 100, 100); // Create a 100*100 rectangle at (20, 20)
ctx.stroke(); // Draw it
}
}
```

### fill
fill(): void
Fills the area inside a closed path on the canvas.
**Example**
```html
```
```js
//xxx.js
export default {
onShow() {
const el =this.$refs.canvas;
const ctx = el.getContext('2d');
ctx.rect(20, 20, 100, 100); // Create a 100*100 rectangle at (20, 20)
ctx.fill(); // Draw it in default setting
}
}
```

### clip
clip(): void
Sets the current path to a clipping path.
**Example**
```html
```
```js
//xxx.js
export default {
onShow() {
const el =this.$refs.canvas;
const ctx = el.getContext('2d');
ctx.rect(0, 0, 200, 200);
ctx.stroke();
ctx.clip();
// Draw red rectangle after clip
ctx.fillStyle = "rgb(255,0,0)";
ctx.fillRect(0, 0, 150, 150);
}
}
```

### rotate
rotate(rotate: number): void
Rotates a canvas clockwise around its coordinate axes.
**Parameters**
| Name | Type | Description |
| ------ | ------ | ---------------------------------------- |
| rotate | number | Clockwise rotation angle. You can use **Math.PI / 180** to convert the angle to a radian.|
**Example**
```html
```
```js
//xxx.js
export default {
onShow() {
const el =this.$refs.canvas;
const ctx = el.getContext('2d');
ctx.rotate(45 * Math.PI / 180); // Rotate the rectangle 45 degrees
ctx.fillRect(70, 20, 50, 50);
}
}
```

### scale
scale(x: number, y: number): void
Scales the canvas based on scale factors.
**Parameters**
| Name | Type | Description |
| ---- | ------ | ----------- |
| x | number | Horizontal scale factor.|
| y | number | Vertical scale factor.|
**Example**
```html
```
```js
//xxx.js
export default {
onShow() {
const el =this.$refs.canvas;
const ctx = el.getContext('2d');
ctx.strokeRect(10, 10, 25, 25);
ctx.scale(2, 2);// Scale to 200%
ctx.strokeRect(10, 10, 25, 25);
}
}
```

### transform
transform(scaleX: number, skewX: number, skewY: number, scale: number, translateX: number, translateY: number): void
Defines a transformation matrix. To transform a graph, you only need to set parameters of the matrix. The coordinates of the graph are multiplied by the matrix values to obtain new coordinates of the transformed graph. You can use the matrix to implement multiple transform effects.
> **NOTE**
> The following formulas calculate coordinates of the transformed graph. **x** and **y** represent coordinates before transformation, and **x'** and **y'** represent coordinates after transformation.
>
> - x' = scaleX \* x + skewY \* y + translateX
>
> - y' = skewX \* x + scaleY \* y + translateY
**Parameters**
| Name | Type | Description |
| ---------- | ------ | -------- |
| scaleX | number | X-axis scale.|
| skewX | number | X-axis skew.|
| skewY | number | Y-axis skew.|
| scaleY | number | Y-axis scale.|
| translateX | number | X-axis translation.|
| translateY | number | Y-axis translation.|
**Example**
```html
```
```js
//xxx.js
export default {
onShow() {
const el =this.$refs.canvas;
const ctx = el.getContext('2d');
ctx.fillStyle = 'rgb(0,0,0)';
ctx.fillRect(0, 0, 100, 100)
ctx.transform(1, 0.5, -0.5, 1, 10, 10);
ctx.fillStyle = 'rgb(255,0,0)';
ctx.fillRect(0, 0, 100, 100);
ctx.transform(1, 0.5, -0.5, 1, 10, 10);
ctx.fillStyle = 'rgb(0,0,255)';
ctx.fillRect(0, 0, 100, 100);
}
}
```

### setTransform
setTransform(scaleX: number, skewX: number, skewY: number, scale: number, translateX: number, translateY: number): void
Resets the existing transformation matrix and creates a new transformation matrix by using the same parameters as the **transform()** API.
**Parameters**
| Name | Type | Description |
| ---------- | ------ | -------- |
| scaleX | number | X-axis scale.|
| skewX | number | X-axis skew.|
| skewY | number | Y-axis skew.|
| scaleY | number | Y-axis scale.|
| translateX | number | X-axis translation.|
| translateY | number | Y-axis translation.|
**Example**
```html
```
```js
//xxx.js
export default {
onShow() {
const el =this.$refs.canvas;
const ctx = el.getContext('2d');
ctx.fillStyle = 'rgb(255,0,0)';
ctx.fillRect(0, 0, 100, 100)
ctx.setTransform(1,0.5, -0.5, 1, 10, 10);
ctx.fillStyle = 'rgb(0,0,255)';
ctx.fillRect(0, 0, 100, 100);
}
}
```

### translate
translate(x: number, y: number): void
Moves the origin of the coordinate system.
**Parameters**
| Name | Type | Description |
| ---- | ------ | -------- |
| x | number | X-axis translation.|
| y | number | Y-axis translation.|
**Example**
```html
```
```js
//xxx.js
export default {
onShow() {
const el =this.$refs.canvas;
const ctx = el.getContext('2d');
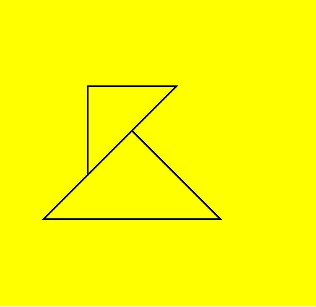
var path1 = ctx.createPath2D();
path1.moveTo(100, 100);
path1.lineTo(200, 100);
path1.lineTo(100, 200);
path1.closePath();
ctx.stroke(path1);
var path2 = ctx.createPath2D("M150 150 L50 250 L250 250 Z");
ctx.stroke(path2);
var path3 = ctx.createPath2D(path2);
ctx.stroke(path3);
}
}
```
### drawImage
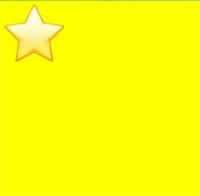
drawImage(image: Image | PixelMap, sx: number, sy: number, sWidth: number, sHeight: number, dx: number, dy: number, dWidth: number, dHeight: number):void
Draws an image on the canvas.
**Parameters**
| Name | Type | Description |
| ------- | ------------------------------ | ---------------------------------------- |
| image | Image \| PixelMap9+ | Image resource. For details, see [Image](../arkui-js/js-components-canvas-image.md) or [PixelMap](../apis/js-apis-image.md#pixelmap7).|
| sx | number | X-coordinate of the upper left corner of the rectangle used to crop the source image. |
| sy | number | Y-coordinate of the upper left corner of the rectangle used to crop the source image. |
| sWidth | number | Target width to crop the source image. |
| sHeight | number | Target height to crop the source image. |
| dx | number | X-coordinate of the upper left corner of the drawing area on the canvas. |
| dy | number | Y-coordinate of the upper left corner of the drawing area on the canvas. |
| dWidth | number | Width of the drawing area. |
| dHeight | number | Height of the drawing area. |
**Example**
```html
```
```js
//xxx.js
export default {
onShow() {
var test = this.$refs.canvas;
var ctx = test.getContext('2d');
var img = new Image();
img.src = 'common/image/test.jpg';
ctx.drawImage(img, 0, 0, 200, 200, 10, 10, 200, 200);
}
}
```
### restore
restore(): void
Restores the saved drawing context.
**Example**
```html
```
```js
//xxx.js
export default {
onShow() {
const el =this.$refs.canvas;
const ctx = el.getContext('2d');
ctx.restore();
}
}
```
### save
save(): void
Saves the current drawing context.
**Example**
```html
```
```js
//xxx.js
export default {
onShow() {
const el =this.$refs.canvas;
const ctx = el.getContext('2d');
ctx.save();
}
}
```
### createLinearGradient6+
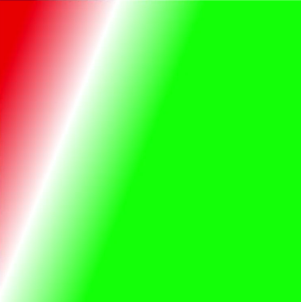
createLinearGradient(x0: number, y0: number, x1: number, y1: number): Object
Creates a linear gradient and returns a **CanvasGradient** object. For details, see [CanvasGradient](../arkui-js/js-components-canvas-canvasgradient.md).
**Parameters**
| Name | Type | Description |
| ---- | ------ | -------- |
| x0 | number | X-coordinate of the start point.|
| y0 | number | Y-coordinate of the start point.|
| x1 | number | X-coordinate of the end point.|
| y1 | number | Y-coordinate of the end point.|
**Return value**
| Type | Description |
| ------ | ---------------------- |
| Object | Created **CanvasGradient** object.|
**Example**
```html
```
```js
// xxx.js
export default {
handleClick() {
const el = this.$refs.canvas;
const ctx = el.getContext('2d');
// Linear gradient: start(50,0) end(300,100)
var gradient = ctx.createLinearGradient(50,0, 300,100);
// Add three color stops
gradient.addColorStop(0.0, '#ff0000');
gradient.addColorStop(0.5, '#ffffff');
gradient.addColorStop(1.0, '#00ff00');
// Set the fill style and draw a rectangle
ctx.fillStyle = gradient;
ctx.fillRect(0, 0, 500, 500);
}
}
```
### createRadialGradient6+
createRadialGradient(x0: number, y0: number, r0: number, x1: number, y1: number, r1: number): Object
Creates a radial gradient and returns a **CanvasGradient** object.
**Parameters**
| Name | Type | Description |
| ---- | ------ | ----------------- |
| x0 | number | X-coordinate of the center of the start circle. |
| y0 | number | Y-coordinate of the center of the start circle. |
| r0 | number | Radius of the start circle, which must be a non-negative finite number.|
| x1 | number | X-coordinate of the center of the end circle. |
| y1 | number | Y-coordinate of the center of the end circle. |
| r1 | number | Radius of the end circle, which must be a non-negative finite number.|
**Return value**
| Type | Description |
| ------ | ---------------------- |
| Object | Created **CanvasGradient** object.|
**Example**
```html
```
```js
// xxx.js
export default {
handleClick() {
const el = this.$refs.canvas;
const ctx = el.getContext('2d');
// Radial gradient: inner circle(200,200,r:50) outer circle(200,200,r:200)
var gradient = ctx.createRadialGradient(200,200,50, 200,200,200);
// Add three color stops
gradient.addColorStop(0.0, '#ff0000');
gradient.addColorStop(0.5, '#ffffff');
gradient.addColorStop(1.0, '#00ff00');
// Set the fill style and draw a rectangle
ctx.fillStyle = gradient;
ctx.fillRect(0, 0, 500, 500);
}
}
```

### createImageData
createImageData(width: number, height: number, imageData: Object): Object
Creates an **ImageData** object. For details, see [ImageData](../arkui-js/js-components-canvas-imagedata.md).
**Parameters**
| Name | Type | Description |
| --------- | ------ | ----------------- |
| width | number | Width of the **ImageData** object. |
| height | number | Height of the **ImageData** object. |
| imagedata | Object | **ImageData** object with the same width and height copied from the original **ImageData** object.|
**Return value**
| Type | Description |
| ------ | ----------------- |
| Object | Created **ImageData** object.|
**Example**
```html
```
```js
//xxx.js
export default {
onShow() {
const el =this.$refs.canvas;
const ctx = el.getContext('2d');
var imageData = ctx.createImageData(50, 100); // Create ImageData with 50px width and 100px height
var newImageData = ctx.createImageData(imageData); // Create ImageData using the input imageData
}
}
```
### getImageData
getImageData(sx: number, sy: number, sw: number, sh: number): Object
Obtains the **ImageData** object created with the pixels within the specified area on the canvas.
**Parameters**
| Name | Type | Description |
| ---- | ------ | --------------- |
| sx | number | X-coordinate of the upper left corner of the output area.|
| sy | number | Y-coordinate of the upper left corner of the output area.|
| sw | number | Width of the output area. |
| sh | number | Height of the output area. |
**Return value**
| Type | Description |
| ------ | ----------------------- |
| Object | **ImageData** object that contains pixels in the specified area on the canvas.|
**Example**
```html
```
```js
//xxx.js
export default {
onShow() {
const test = this.$element('getImageData')
const ctx = test.getContext('2d');
var imageData = ctx.getImageData(0, 0, 280, 300);
}
}
```
### putImageData
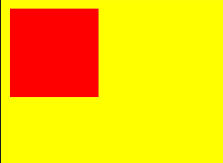
putImageData(imageData: Object, dx: number, dy: number, dirtyX: number, dirtyY: number, dirtyWidth: number, dirtyHeight: number): void
Puts the **ImageData** onto a rectangular area on the canvas.
**Parameters**
| Name | Type | Description |
| ----------- | ------ | ----------------------------- |
| imagedata | Object | **ImageData** object with pixels to put onto the canvas. |
| dx | number | X-axis offset of the rectangular area on the canvas. |
| dy | number | Y-axis offset of the rectangular area on the canvas. |
| dirtyX | number | X-axis offset of the upper left corner of the rectangular area relative to that of the source image.|
| dirtyY | number | Y-axis offset of the upper left corner of the rectangular area relative to that of the source image.|
| dirtyWidth | number | Width of the rectangular area to crop the source image. |
| dirtyHeight | number | Height of the rectangular area to crop the source image. |
**Example**
```html
```
```js
//xxx.js
export default {
onShow() {
const test = this.$element('getImageData')
const ctx = test.getContext('2d');
var imgData = ctx.createImageData(100, 100);
for (var i = 0; i < imgData.data.length; i += 4) {
imgData.data[i + 0] = 255;
imgData.data[i + 1] = 0;
imgData.data[i + 2] = 0;
imgData.data[i + 3] = 255;
}
ctx.putImageData(imgData, 10, 10);
}
}
```
### getPixelMap9+
getPixelMap(sx: number, sy: number, sw: number, sh: number): PixelMap
Obtains the **PixelMap** object created with the pixels within the specified area on the canvas.
**Parameters**
| Name | Type | Description |
| ---- | ------ | ------------ |
| sx | number | X-coordinate of the upper left corner of the specified area.|
| sy | number | Y-coordinate of the upper left corner of the specified area.|
| sw | number | Width of the specified area. |
| sh | number | Height of the specified area. |
**Return value**
| Type | Description |
| ---------------------------------------- | ---------------------- |
| [PixelMap](../apis/js-apis-image.md#pixelmap7) | **PixelMap** object that contains pixels in the specified area on the canvas.|
**Example**
```html
```
```js
//xxx.js
export default {
onShow() {
const test = this.$element('canvasId')
const ctx = test.getContext('2d');
var pixelMap = ctx.getPixelMap(0, 0, 280, 300);
}
}
```
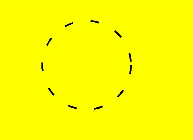
### setLineDash
setLineDash(segments: Array): void
Sets the dash line style.
**Parameters**
| Name | Type | Description |
| -------- | ----- | -------------------- |
| segments | Array | An array describing the interval of alternate line segments and length of spacing.|
**Example**
```html
```
```js
//xxx.js
export default {
onShow() {
const el =this.$refs.canvas;
const ctx = el.getContext('2d');
ctx.arc(100, 75, 50, 0, 6.28);
ctx.setLineDash([10,20]);
ctx.stroke();
}
}
```
### getLineDash
getLineDash(): Array
Obtains the dash line style.
**Return value**
| Type | Description |
| ----- | ------------------------ |
| Array | An array describing the interval of alternate line segments and length of spacing.|
**Example**
```html
```
```js
//xxx.js
export default {
onShow() {
const el =this.$refs.canvas;
const ctx = el.getContext('2d');
var info = ctx.getLineDash();
}
}
```
### transferFromImageBitmap7+
transferFromImageBitmap(bitmap: ImageBitmap): void
Displays the specified **ImageBitmap** object.
**Parameters**
| Name | Type | Description |
| ------ | ----------- | ------------------ |
| bitmap | ImageBitmap | **ImageBitmap** object to display.|
**Example**
```html
```
```js
//xxx.js
export default {
onShow() {
const el =this.$refs.canvas;
const ctx = el.getContext('2d');
var canvas = this.$refs.canvas.getContext('2d');
var offscreen = new OffscreenCanvas(500,500);
var offscreenCanvasCtx = offscreen.getContext("2d");
offscreenCanvasCtx.fillRect(0, 0, 200, 200);
var bitmap = offscreen.transferToImageBitmap();
canvas.transferFromImageBitmap(bitmap);
}
}
```
