# Use Grafana As The UI
Since 9.4.0, SkyWalking provide [PromQL Service](../../api/promql-service.md). You can choose [Grafana](https://grafana.com/)
as the SkyWalking UI. About the installation and how to use please refer to the [official document](https://grafana.com/docs/grafana/v9.3/).
Notice <1>, Gafana is [AGPL-3.0 license](https://github.com/grafana/grafana/blob/main/LICENSE), which is very different from Apache 2.0.
Please follow AGPL 3.0 license requirements.
Notice <2>, SkyWalking always uses its native UI as first class. All visualization features are only available on native UI.
Grafana UI is an extension on our support of PromQL APIs. We don't maintain or promise the complete Grafana UI dashboard setup.
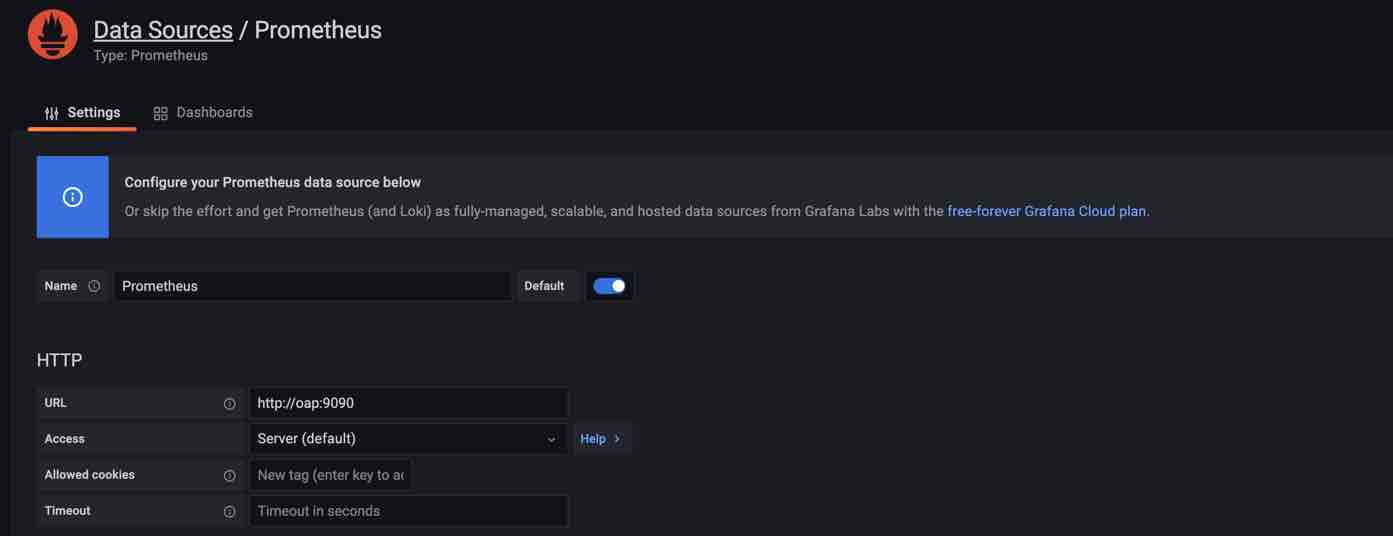
## Configure Data Source
In the data source config panel, chose the `Prometheus` and set the url to the OAP server address, the default port is `9090`.
 ## Configure Dashboards
### Dashboards Settings
The following steps are the example of config a `General Service` dashboard:
1. Create a dashboard named `General Service`. A [layer](../../../../oap-server/server-core/src/main/java/org/apache/skywalking/oap/server/core/analysis/Layer.java) is recommended as a dashboard.
2. Configure variables for the dashboard:
## Configure Dashboards
### Dashboards Settings
The following steps are the example of config a `General Service` dashboard:
1. Create a dashboard named `General Service`. A [layer](../../../../oap-server/server-core/src/main/java/org/apache/skywalking/oap/server/core/analysis/Layer.java) is recommended as a dashboard.
2. Configure variables for the dashboard:
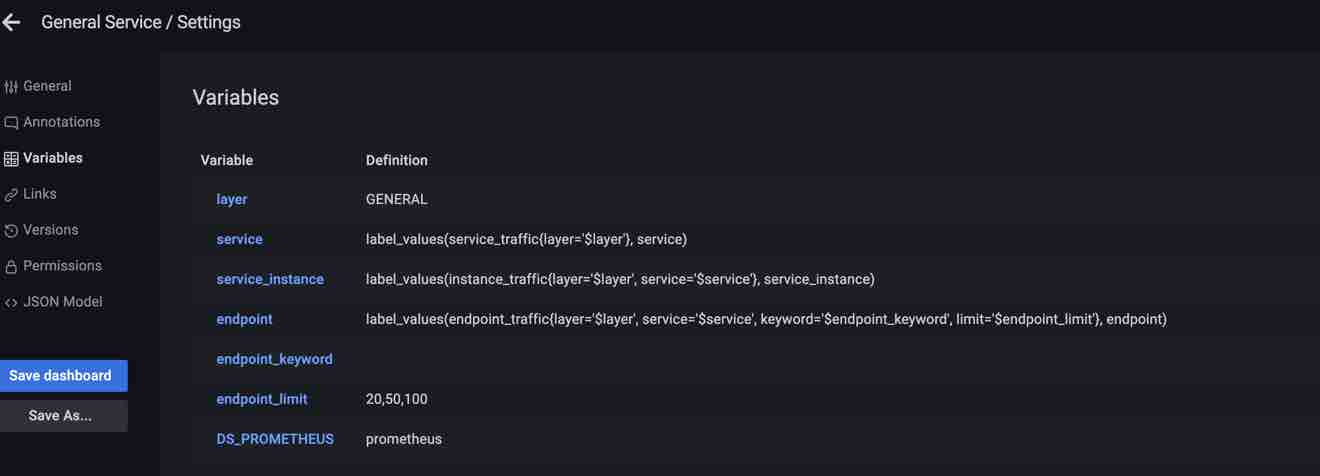 After configure, you can select the service/instance/endpoint on the top of the dashboard:
 ### Add Panels
The following contents show how to add several typical metrics panels.
General settings:
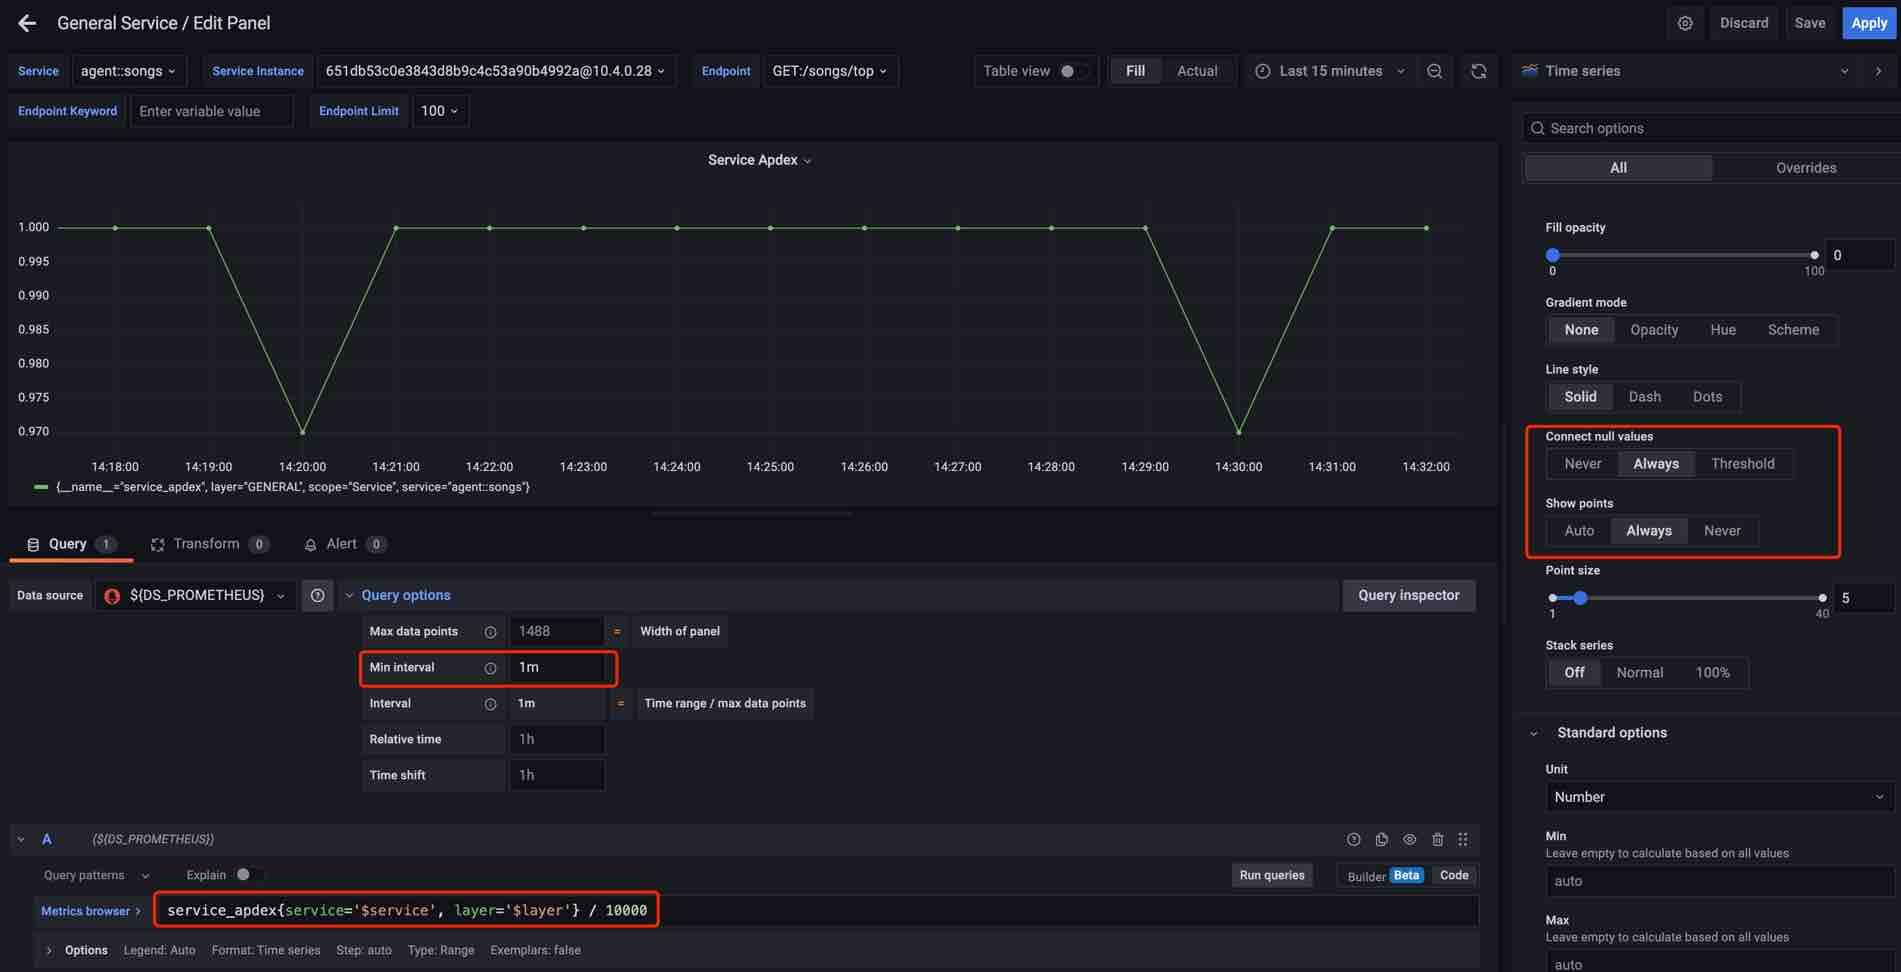
1. Chose the metrics and chart.
2. Set `Query options --> Min interval = 1m`, because the metrics min time bucket in SkyWalking is 1m.
3. Add PromQL expressions, use the variables configured above for the labels then you can select the labels value from top.
**Note: Some metrics values may be required calculations to match units.**
4. Select the returned labels you want to show on panel.
5. Test query and save the panel.
#### Common Value Metrics
1. For example `service_apdex` and `Time series chart`.
2. Add PromQL expression, the metric scope is `Service`, so add labels `service` and `layer` for match.
3. Set `Connect null values --> Always` and `Show points --> Always` because when the query interval > 1hour or 1day SkyWalking return
the hour/day step metrics values.
### Add Panels
The following contents show how to add several typical metrics panels.
General settings:
1. Chose the metrics and chart.
2. Set `Query options --> Min interval = 1m`, because the metrics min time bucket in SkyWalking is 1m.
3. Add PromQL expressions, use the variables configured above for the labels then you can select the labels value from top.
**Note: Some metrics values may be required calculations to match units.**
4. Select the returned labels you want to show on panel.
5. Test query and save the panel.
#### Common Value Metrics
1. For example `service_apdex` and `Time series chart`.
2. Add PromQL expression, the metric scope is `Service`, so add labels `service` and `layer` for match.
3. Set `Connect null values --> Always` and `Show points --> Always` because when the query interval > 1hour or 1day SkyWalking return
the hour/day step metrics values.
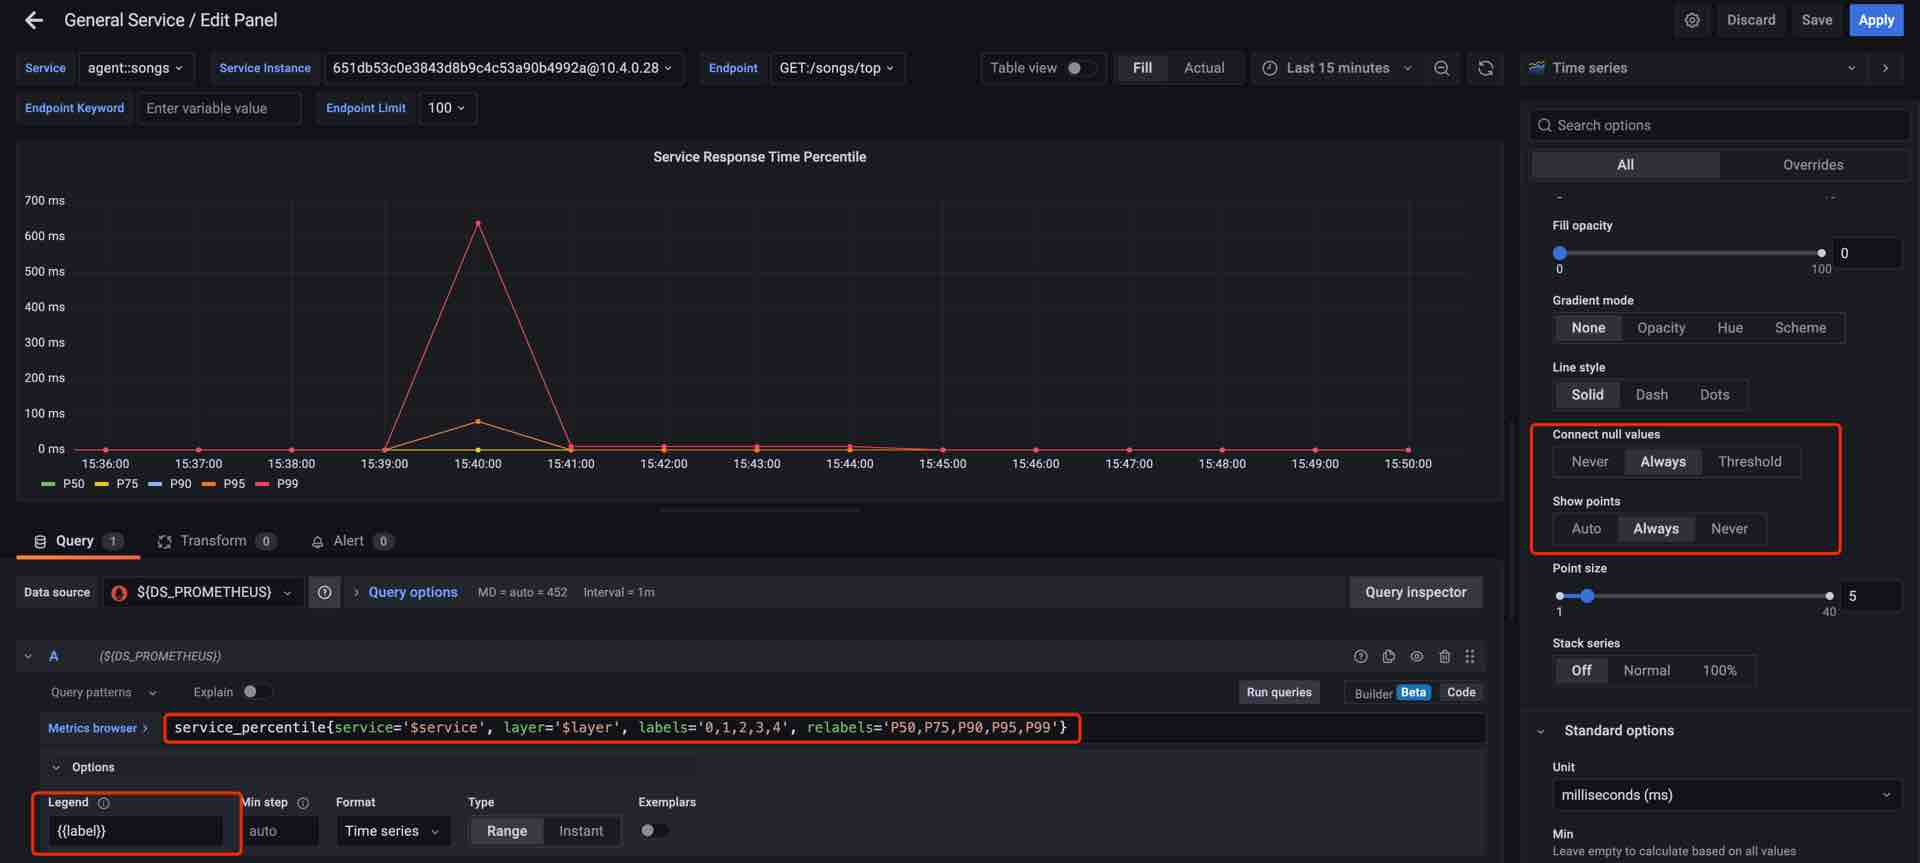
 #### Labeled Value Metrics
1. For example `service_percentile` and `Time series chart`.
2. Add PromQL expressions, the metric scope is `Service`, add labels `service` and `layer` for match.
And it's a labeled value metric, add `labels='0,1,2,3,4'` filter the result label, and add`relabels='P50,P75,P90,P95,P99'` rename the result label.
3. Set `Connect null values --> Always` and `Show points --> Always` because when the query interval > 1hour or 1day SkyWalking return
the hour/day step metrics values.
#### Labeled Value Metrics
1. For example `service_percentile` and `Time series chart`.
2. Add PromQL expressions, the metric scope is `Service`, add labels `service` and `layer` for match.
And it's a labeled value metric, add `labels='0,1,2,3,4'` filter the result label, and add`relabels='P50,P75,P90,P95,P99'` rename the result label.
3. Set `Connect null values --> Always` and `Show points --> Always` because when the query interval > 1hour or 1day SkyWalking return
the hour/day step metrics values.
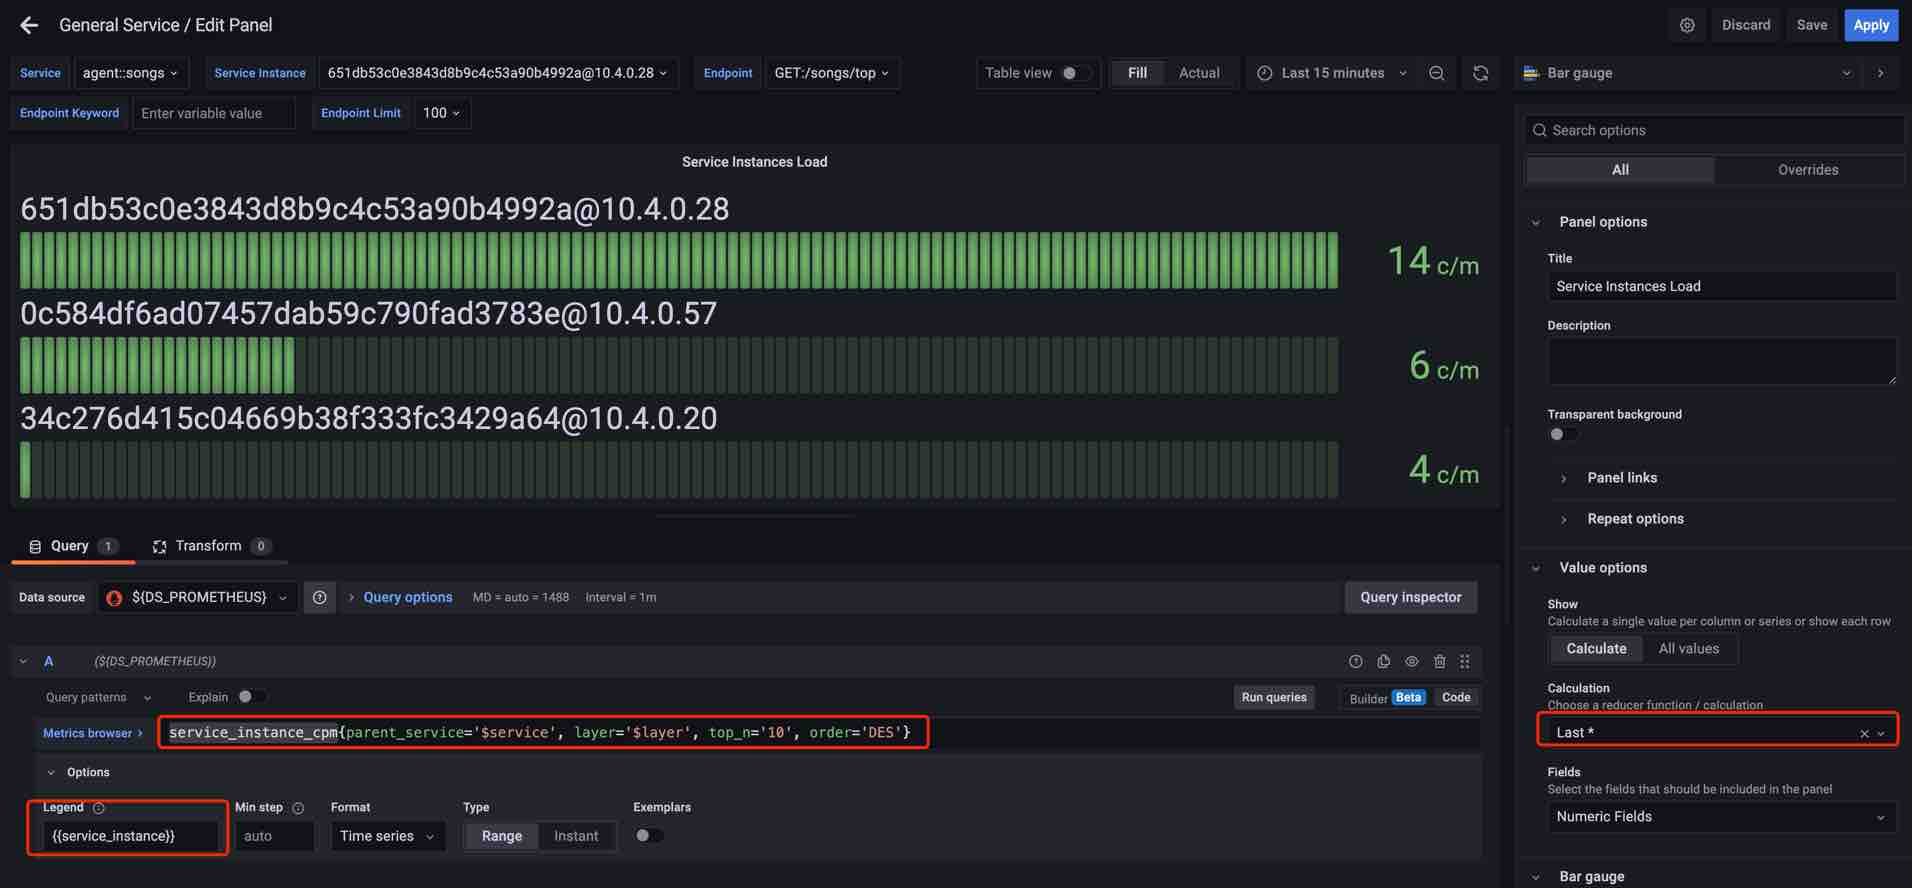
 #### Sort Metrics
1. For example `service_instance_cpm` and `Bar gauge chart`.
2. Add PromQL expressions, add labels `parent_service` and `layer` for match, add `top_n='10'` and `order='DES'` filter the result.
3. Set the `Calculation --> Latest*`.
#### Sort Metrics
1. For example `service_instance_cpm` and `Bar gauge chart`.
2. Add PromQL expressions, add labels `parent_service` and `layer` for match, add `top_n='10'` and `order='DES'` filter the result.
3. Set the `Calculation --> Latest*`.
 #### Sampled Records
Same as the Sort Metrics.
#### Sampled Records
Same as the Sort Metrics.