This tutorial introduces techniques we used to profile and tune the
CPU performance of PaddlePaddle. We will use Python packages
cProfile and yep, and Google perftools.
Profiling is the process that reveals the performance bottlenecks, which could be very different from what’s in the developers’ mind. Performance tuning is to fix the bottlenecks. Performance optimization repeats the steps of profiling and tuning alternatively.
PaddlePaddle users program AI by calling the Python API, which calls
into libpaddle.so. written in C++. In this tutorial, we focus on
the profiling and tuning of
- the Python code and
- the mixture of Python and C++ code.
Profiling the Python Code
Generate the Performance Profiling File
We can use Python standard
package, cProfile,
to generate Python profiling file. For example:
python -m cProfile -o profile.out main.py
where main.py is the program we are going to profile, -o specifies
the output file. Without -o, cProfile would outputs to standard
output.
Look into the Profiling File
cProfile generates profile.out after main.py completes. We can
use cprofilev to look into
the details:
cprofilev -a 0.0.0.0 -p 3214 -f profile.out main.py
where -a specifies the HTTP IP, -p specifies the port, -f
specifies the profiling file, and main.py is the source file.
Open the Web browser and points to the local IP and the specifies port, we will see the output like the following:
   ncalls  tottime  percall  cumtime  percall filename:lineno(function)
        1    0.284    0.284   29.514   29.514 main.py:1(<module>)
     4696    0.128    0.000   15.748    0.003 /home/yuyang/perf_test/.env/lib/python2.7/site-packages/paddle/v2/fluid/executor.py:20(run)
     4696   12.040    0.003   12.040    0.003 {built-in method run}
        1    0.144    0.144    6.534    6.534 /home/yuyang/perf_test/.env/lib/python2.7/site-packages/paddle/v2/__init__.py:14(<module>)
where each line corresponds to Python function, and the meaning of each column is as follows:
| column | meaning | | — | — | | ncalls | the number of calls into a function | | tottime | the total execution time of the function, not including the execution time of other functions called by the function | | percall | tottime divided by ncalls | | cumtime | the total execution time of the function, including the execution time of other functions being called | | percall | cumtime divided by ncalls | | filename:lineno(function) | where the function is defined |
Identify Performance Bottlenecks
Usually, tottime and the related percall time is what we want to
focus on. We can sort above profiling file by tottime:
     4696   12.040    0.003   12.040    0.003 {built-in method run}
   300005    0.874    0.000    1.681    0.000 /home/yuyang/perf_test/.env/lib/python2.7/site-packages/paddle/v2/dataset/mnist.py:38(reader)
   107991    0.676    0.000    1.519    0.000 /home/yuyang/perf_test/.env/lib/python2.7/site-packages/paddle/v2/fluid/framework.py:219(__init__)
     4697    0.626    0.000    2.291    0.000 /home/yuyang/perf_test/.env/lib/python2.7/site-packages/paddle/v2/fluid/framework.py:428(sync_with_cpp)
        1    0.618    0.618    0.618    0.618 /home/yuyang/perf_test/.env/lib/python2.7/site-packages/paddle/v2/fluid/__init__.py:1(<module>)
We can see that the most time-consuming function is the built-in method run, which is a C++ function in libpaddle.so. We will
explain how to profile C++ code in the next section. At the right
moment, let’s look into the third function sync_with_cpp, which is a
Python function. We can click it to understand more about it:
Called By:

   Ordered by: internal time
   List reduced from 4497 to 2 due to restriction <'sync_with_cpp'>

Function                                                                                                 was called by...
                                                                                                             ncalls  tottime  cumtime
/home/yuyang/perf_test/.env/lib/python2.7/site-packages/paddle/v2/fluid/framework.py:428(sync_with_cpp)  <-    4697    0.626    2.291  /home/yuyang/perf_test/.env/lib/python2.7/site-packages/paddle/v2/fluid/framework.py:562(sync_with_cpp)
/home/yuyang/perf_test/.env/lib/python2.7/site-packages/paddle/v2/fluid/framework.py:562(sync_with_cpp)  <-    4696    0.019    2.316  /home/yuyang/perf_test/.env/lib/python2.7/site-packages/paddle/v2/fluid/framework.py:487(clone)
                                                                                                                  1    0.000    0.001  /home/yuyang/perf_test/.env/lib/python2.7/site-packages/paddle/v2/fluid/framework.py:534(append_backward)


Called:

   Ordered by: internal time
   List reduced from 4497 to 2 due to restriction <'sync_with_cpp'>
The lists of the callers of sync_with_cpp might help us understand
how to improve the function definition.
Profiling Python and C++ Code
Generate the Profiling File
To profile a mixture of Python and C++ code, we can use a Python
package, yep, that can work with Google’s perftools, which is a
commonly-used profiler for C/C++ code.
In Ubuntu systems, we can install yep and perftools by running the
following commands:
apt update
apt install libgoogle-perftools-dev
pip install yep
Then we can run the following command
python -m yep -v main.py
to generate the profiling file. The default filename is
main.py.prof.
Please be aware of the -v command line option, which prints the
analysis results after generating the profiling file. By taking a
glance at the print result, we’d know that if we stripped debug
information from libpaddle.so at build time. The following hints
help make sure that the analysis results are readable:
- Use GCC command line option
-gwhen buildinglibpaddle.soso to include the debug information. The standard building system of PaddlePaddle is CMake, so you might want to setCMAKE_BUILD_TYPE=RelWithDebInfo. - Use GCC command line option
-O2or-O3to generate optimized binary code. It doesn’t make sense to profilelibpaddle.sowithout optimization, because it would anyway run slowly. - Profiling the single-threaded binary file before the
multi-threading version, because the latter often generates tangled
profiling analysis result. You might want to set environment
variable
OMP_NUM_THREADS=1to prevents OpenMP from automatically starting multiple threads.
Look into the Profiling File
The tool we used to look into the profiling file generated by
perftools is pprof, which
provides a Web-based GUI like cprofilev.
We can rely on the standard Go toolchain to retrieve the source code
of pprof and build it:
go get github.com/google/pprof
Then we can use it to profile main.py.prof generated in the previous
section:
pprof -http=0.0.0.0:3213 `which python` ./main.py.prof
Where -http specifies the IP and port of the HTTP service.
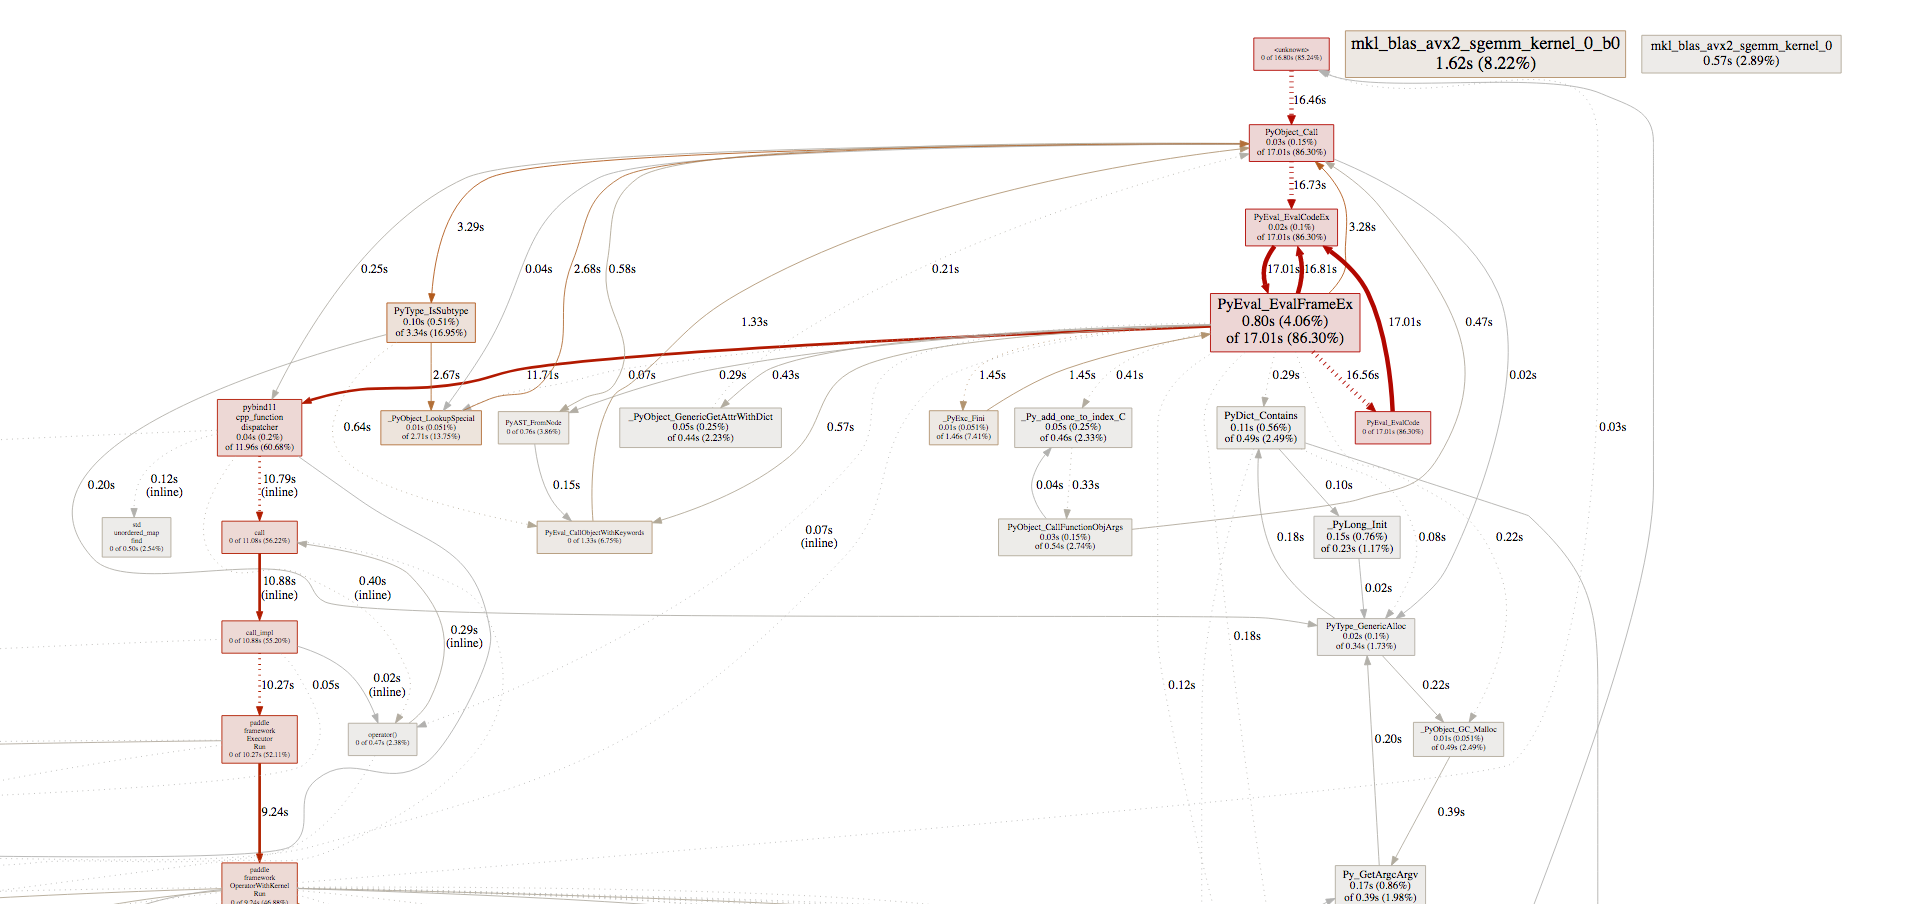
Directing our Web browser to the service, we would see something like
the following:

Identifying the Performance Bottlenecks
Similar to how we work with cprofilev, we’d focus on tottime and
cumtime.

We can see that the execution time of multiplication and the computing
of the gradient of multiplication takes 2% to 4% of the total running
time, and MomentumOp takes about 17%. Obviously, we’d want to
optimize MomentumOp.
pprof would mark performance critical parts of the program in
red. It’s a good idea to follow the hint.
